VI and VO Daily Summary
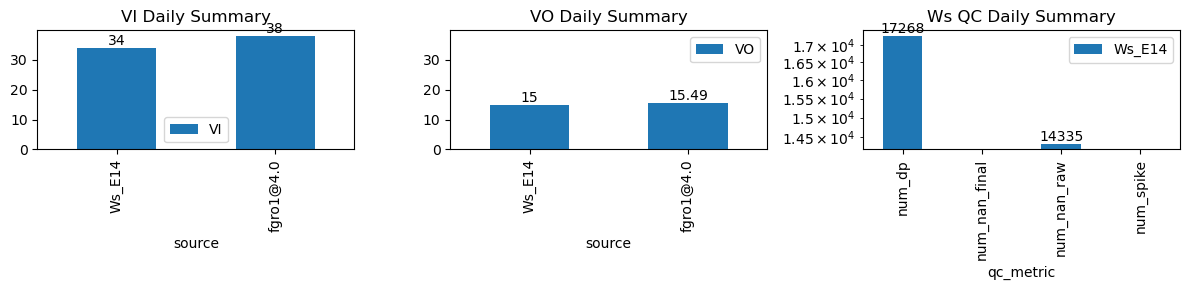
| ws_name | num_dp | num_nan_raw | num_nan_final | num_spike | cum_step_adj |
|---|---|---|---|---|---|
| Ws_E14 | 17,268 | 14,335 | 0 | 0 | 0.00 |
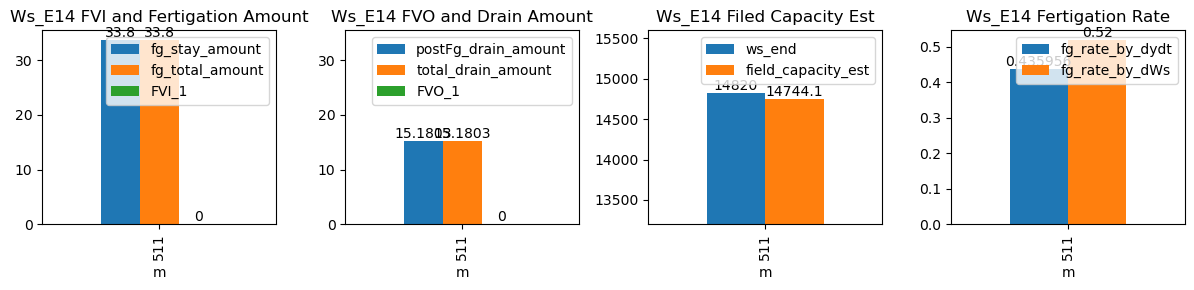
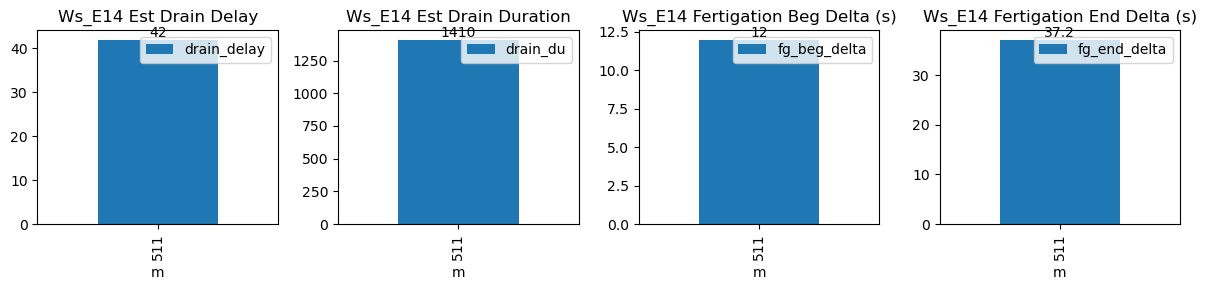
| ds | d | m | ws_name | prominence_cut | max_drain_du | fg_beg | fg_beg_est | fg_end | fg_end_est | ws_beg | ws_end | duc | pre_fg_et | post_fg_ws | post_drn_et | fg_rate_by_dydt | fg_rate_by_dWs | fg_stay_amount | enough_data | fg_beg_delta | fg_end_delta | fg_total_amount | fg_drain_amount | postFg_drain_amount | total_drain_amount | drain_du | drain_delay | drain_rate | field_capacity_est | FVI_1 | FVO_1 |
|---|---|---|---|---|---|---|---|---|---|---|---|---|---|---|---|---|---|---|---|---|---|---|---|---|---|---|---|---|---|---|---|
| 2026-03-03 08:31:33+08:00 | 148 | 511 | Ws_E14 | 0.289814 | 30 | 511.55 | 511.75 | 512.63 | 513.083333 | 14651.0 | 14820.0 | 65 | -0.002599 | -0.525694 | -0.018472 | 0.435956 | 0.52 | 33.8 | True | 12.0 | 27.2 | 33.8 | 0.0 | 15.180332 | 15.180332 | 1014 | 42 | -1.094154 | 14744.098339 | NaN | NaN |