| 2026-03-02 08:02:57+08:00 |
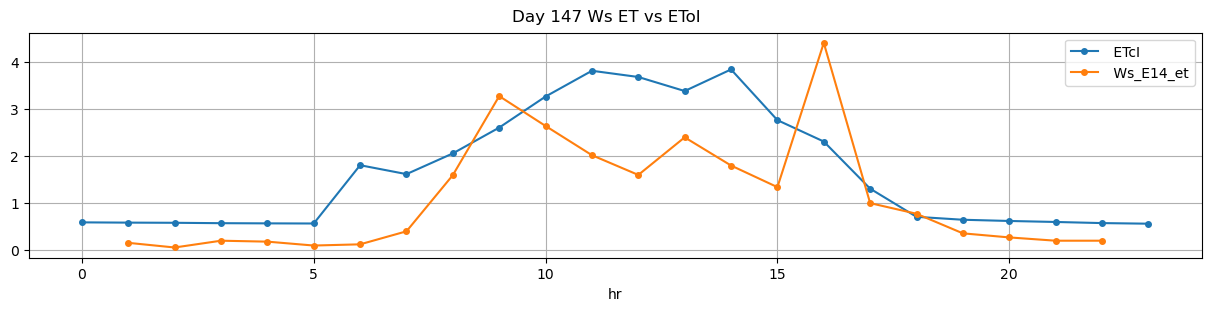
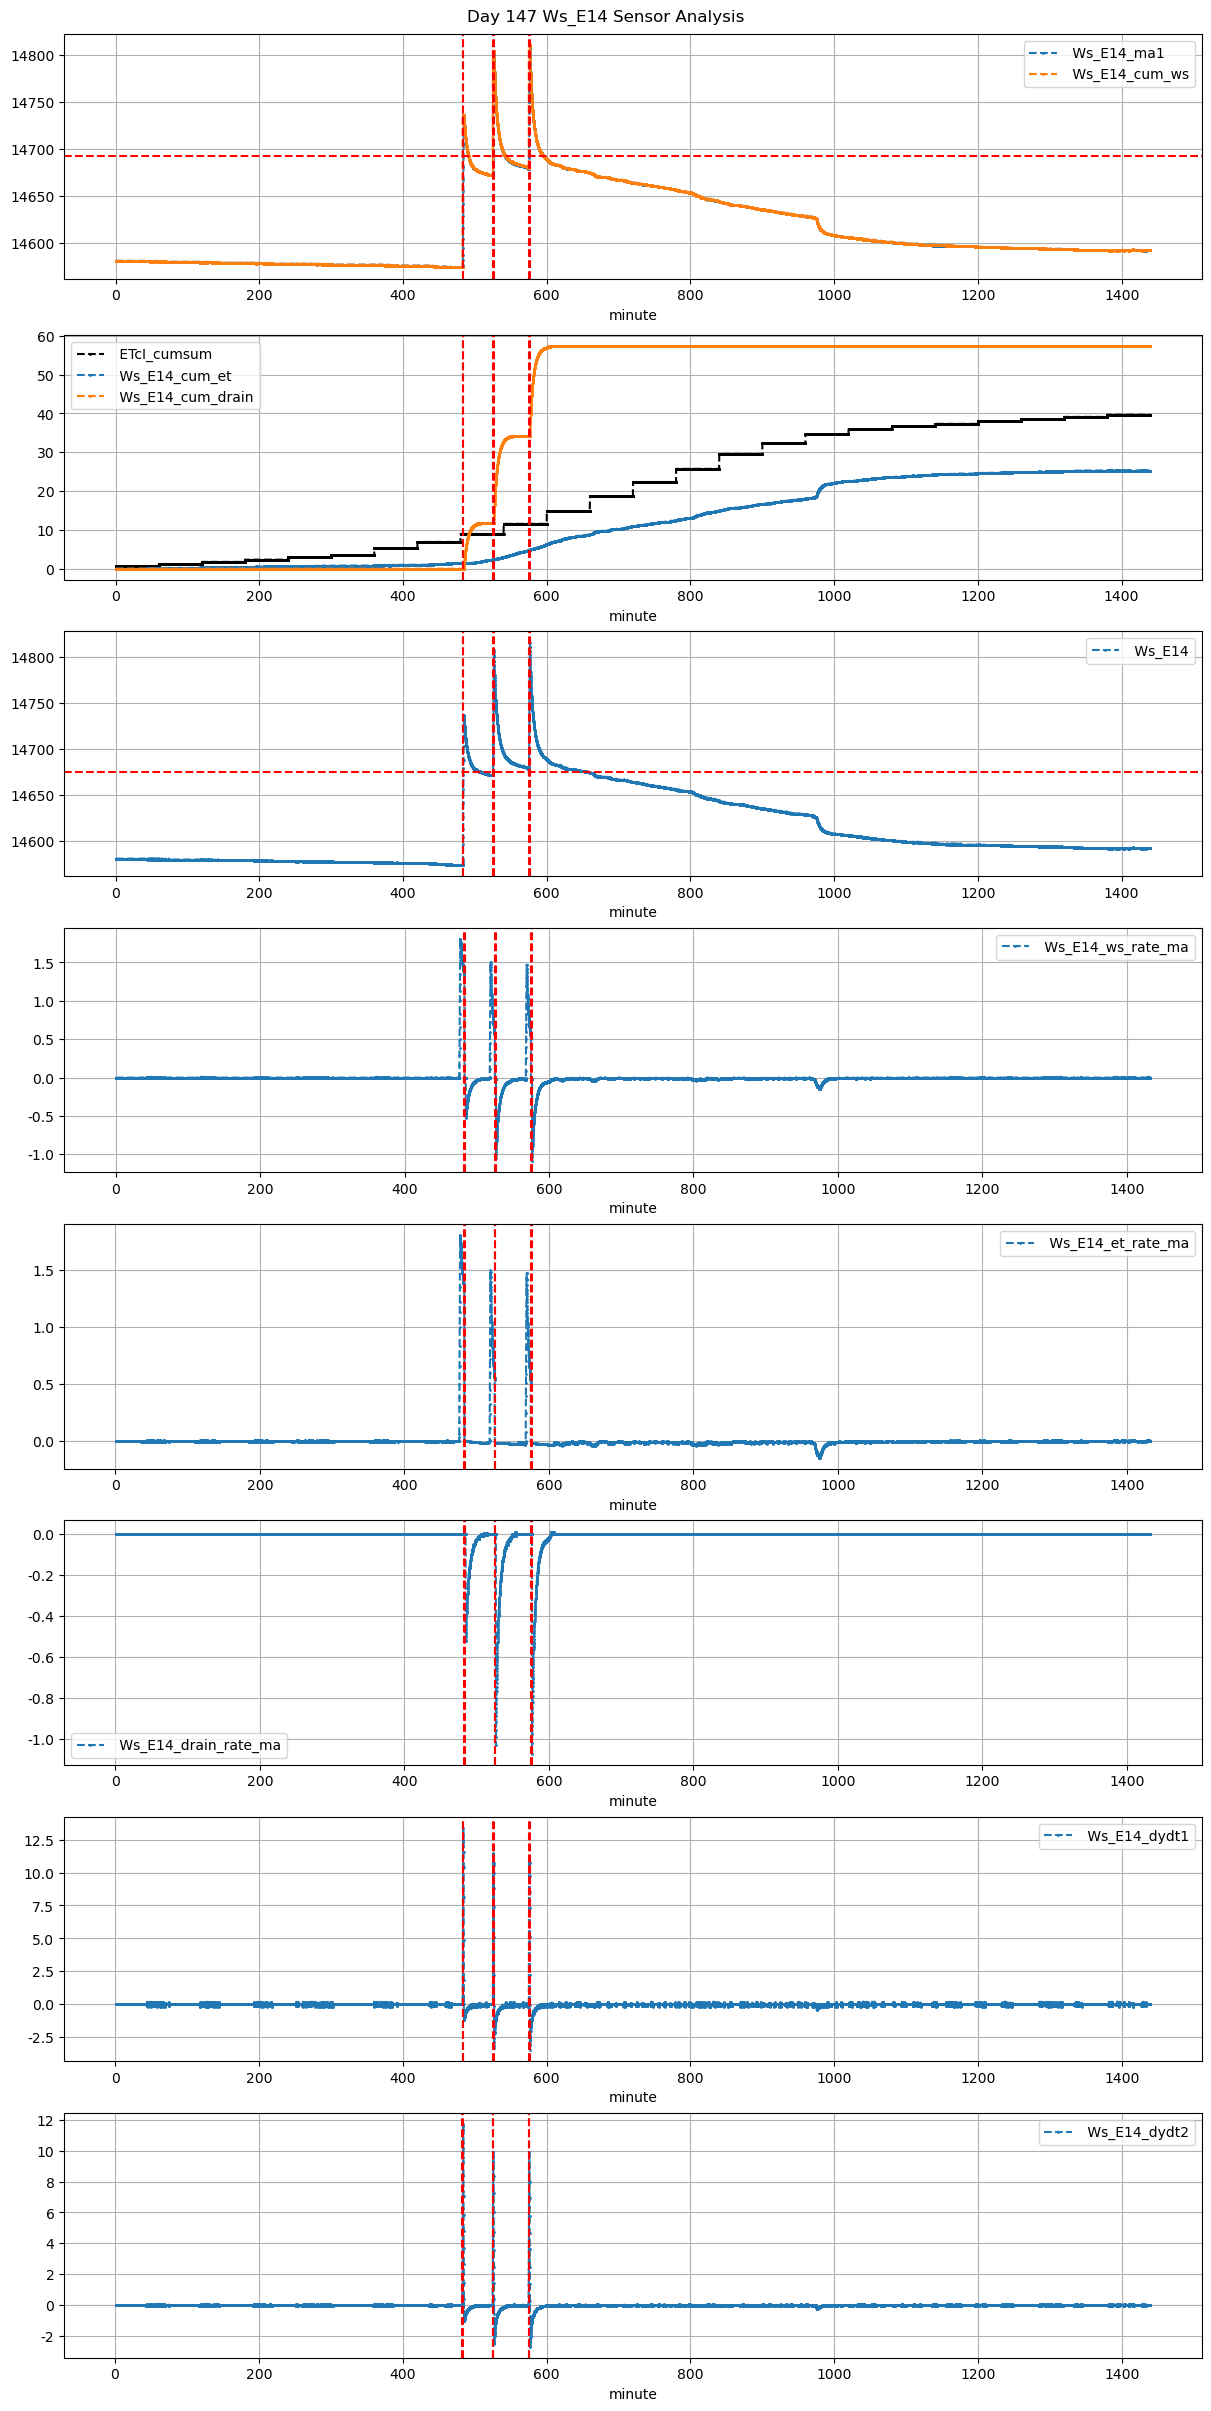
147 |
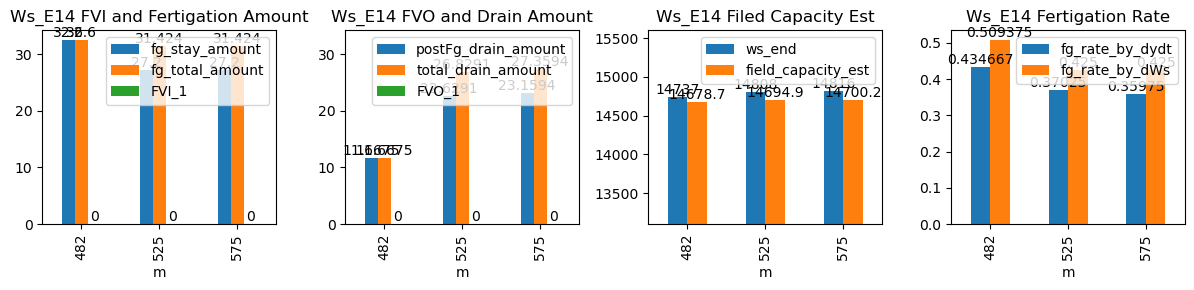
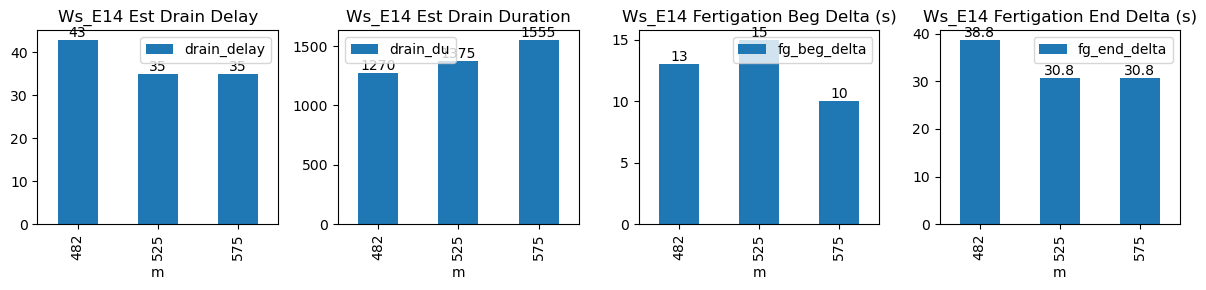
482 |
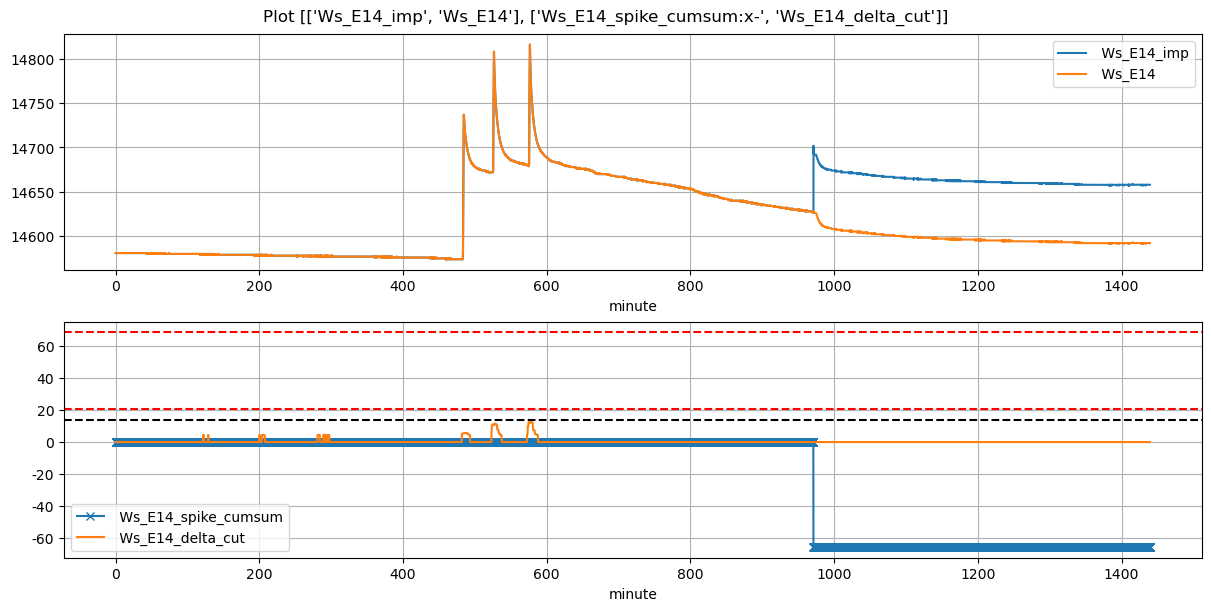
Ws_E14 |
0.642012 |
30 |
482.95 |
483.166667 |
484.02 |
484.583333 |
14574.0 |
14737.0 |
64 |
0.000000 |
-0.400617 |
-0.018843 |
0.434667 |
0.509375 |
32.6 |
True |
13.0 |
33.8 |
32.600 |
0.0 |
11.667454 |
11.667454 |
670 |
48 |
-0.999291 |
14678.662732 |
NaN |
NaN |
| 2026-03-02 08:45:00+08:00 |
147 |
525 |
Ws_E14 |
0.642012 |
30 |
525.00 |
525.250000 |
526.07 |
526.583333 |
14672.0 |
14808.0 |
64 |
-0.011864 |
-0.718750 |
-0.022014 |
0.370250 |
0.425000 |
27.2 |
True |
15.0 |
30.8 |
31.424 |
4.2 |
22.629086 |
26.829086 |
965 |
35 |
-1.587703 |
14694.854570 |
NaN |
NaN |
| 2026-03-02 09:35:00+08:00 |
147 |
575 |
Ws_E14 |
0.642012 |
30 |
575.00 |
575.166667 |
576.07 |
576.583333 |
14680.0 |
14816.0 |
64 |
-0.019350 |
-0.733796 |
-0.030969 |
0.359750 |
0.425000 |
27.2 |
True |
10.0 |
30.8 |
31.424 |
4.2 |
23.159437 |
27.359437 |
880 |
35 |
-1.580221 |
14700.202816 |
NaN |
NaN |