| 2026-02-21 08:14:09+08:00 |
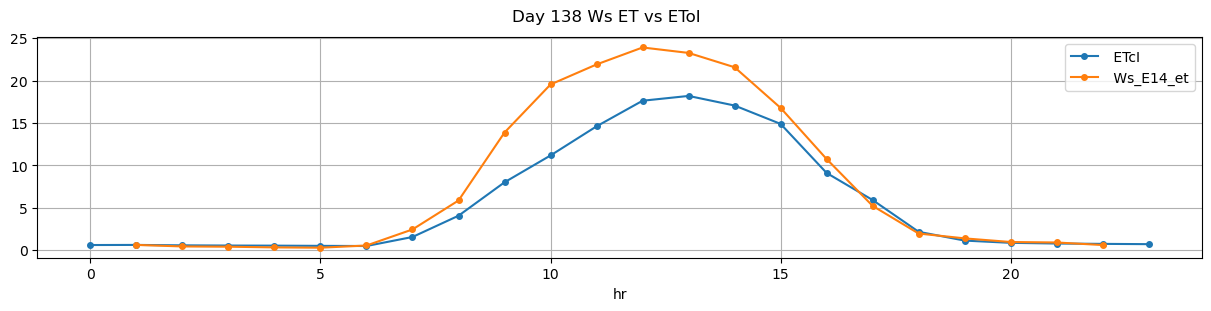
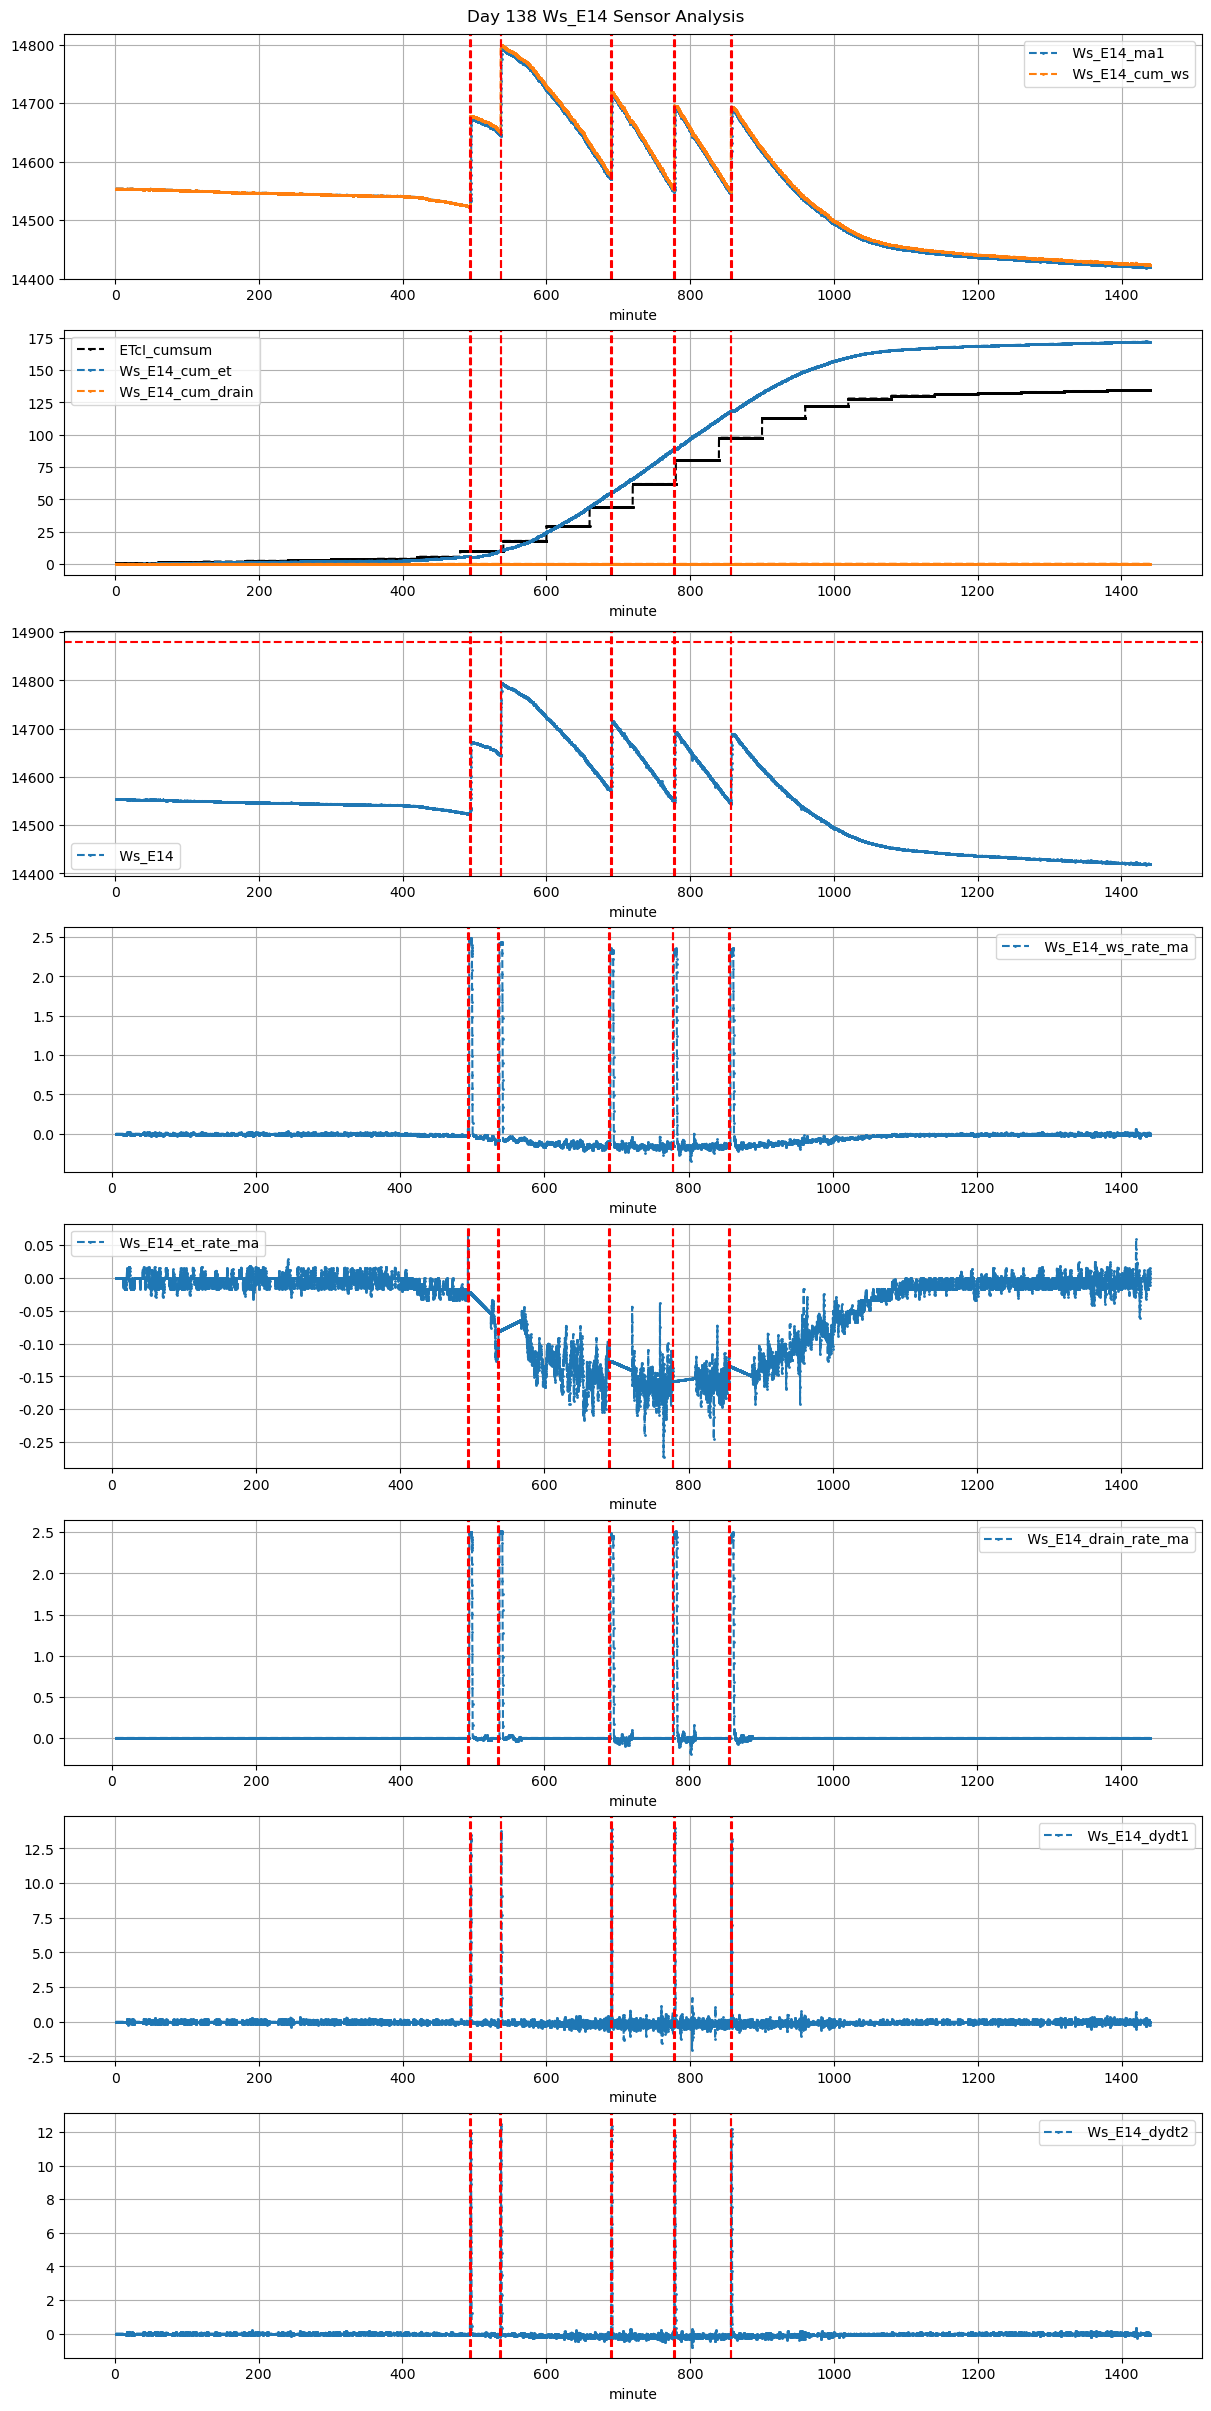
138 |
494 |
Ws_E14 |
0.38495 |
30 |
494.15 |
494.416667 |
495.05 |
495.666667 |
14523.000000 |
14672.000000 |
54 |
-0.020738 |
-0.028125 |
-0.054583 |
0.454000 |
0.551852 |
29.80 |
True |
16.0 |
37.0 |
30.024 |
0.0 |
0 |
0.0 |
24 |
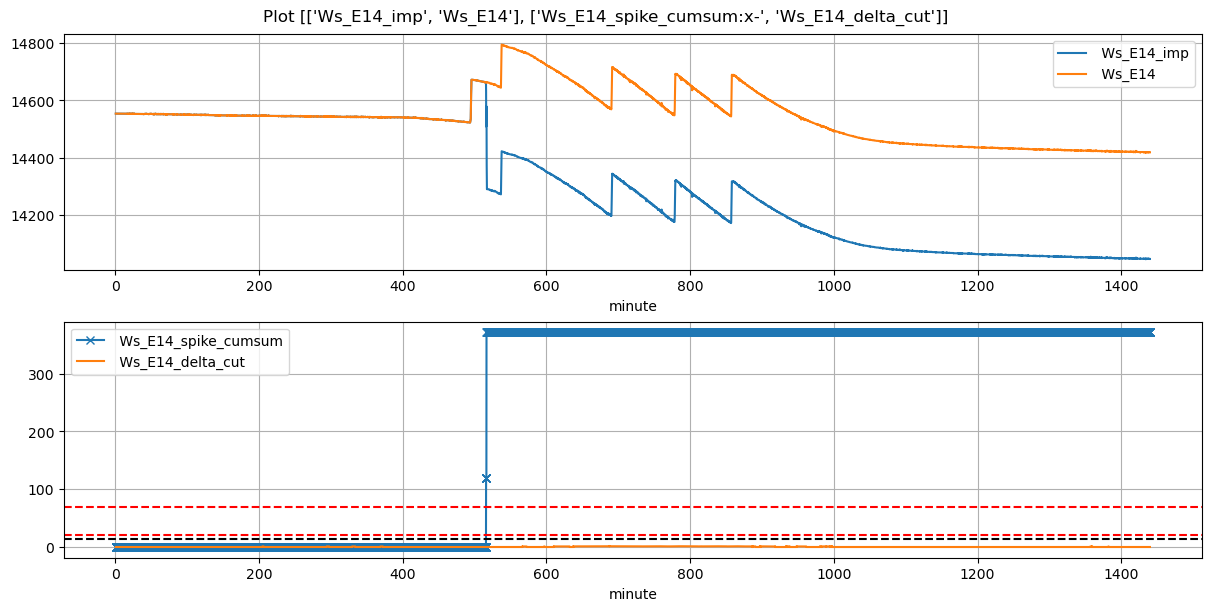
517 |
-0.163482 |
NaN |
NaN |
NaN |
| 2026-02-21 08:56:14+08:00 |
138 |
536 |
Ws_E14 |
0.38495 |
30 |
536.23 |
536.583333 |
537.13 |
537.666667 |
14646.333333 |
14794.333333 |
54 |
-0.108302 |
-0.080417 |
-0.064181 |
0.470692 |
0.548148 |
29.60 |
True |
21.2 |
32.2 |
30.024 |
0.0 |
0 |
0.0 |
25 |
1112 |
-0.128335 |
NaN |
NaN |
NaN |
| 2026-02-21 11:30:00+08:00 |
138 |
690 |
Ws_E14 |
0.38495 |
30 |
690.00 |
690.333333 |
690.90 |
691.583333 |
14572.333333 |
14716.333333 |
54 |
-0.126365 |
-0.154931 |
-0.140694 |
0.459000 |
0.533333 |
28.80 |
True |
20.0 |
41.0 |
30.024 |
0.0 |
0 |
0.0 |
9 |
126 |
-0.370256 |
NaN |
NaN |
NaN |
| 2026-02-21 12:57:55+08:00 |
138 |
777 |
Ws_E14 |
0.38495 |
30 |
777.92 |
778.250000 |
778.82 |
779.416667 |
14550.033333 |
14692.333333 |
54 |
-0.157333 |
-0.175347 |
-0.152636 |
0.447900 |
0.527037 |
28.46 |
True |
19.8 |
35.8 |
30.024 |
0.0 |
0 |
0.0 |
15 |
450 |
-0.595342 |
NaN |
NaN |
NaN |
| 2026-02-21 14:16:34+08:00 |
138 |
856 |
Ws_E14 |
0.38495 |
30 |
856.57 |
856.916667 |
857.47 |
858.000000 |
14547.333333 |
14689.333333 |
54 |
-0.146806 |
-0.134944 |
-0.149421 |
0.458700 |
0.525926 |
28.40 |
True |
20.8 |
31.8 |
30.024 |
0.0 |
0 |
0.0 |
15 |
371 |
-0.308858 |
NaN |
NaN |
NaN |