| 2026-03-06 08:31:25+08:00 |
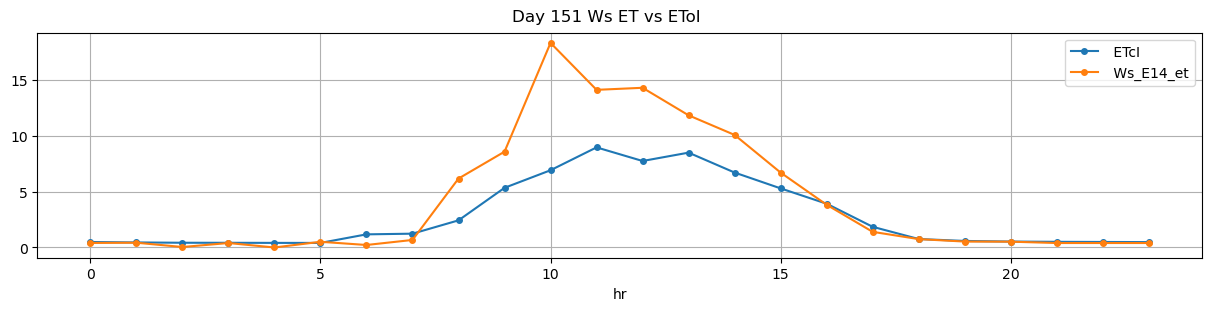
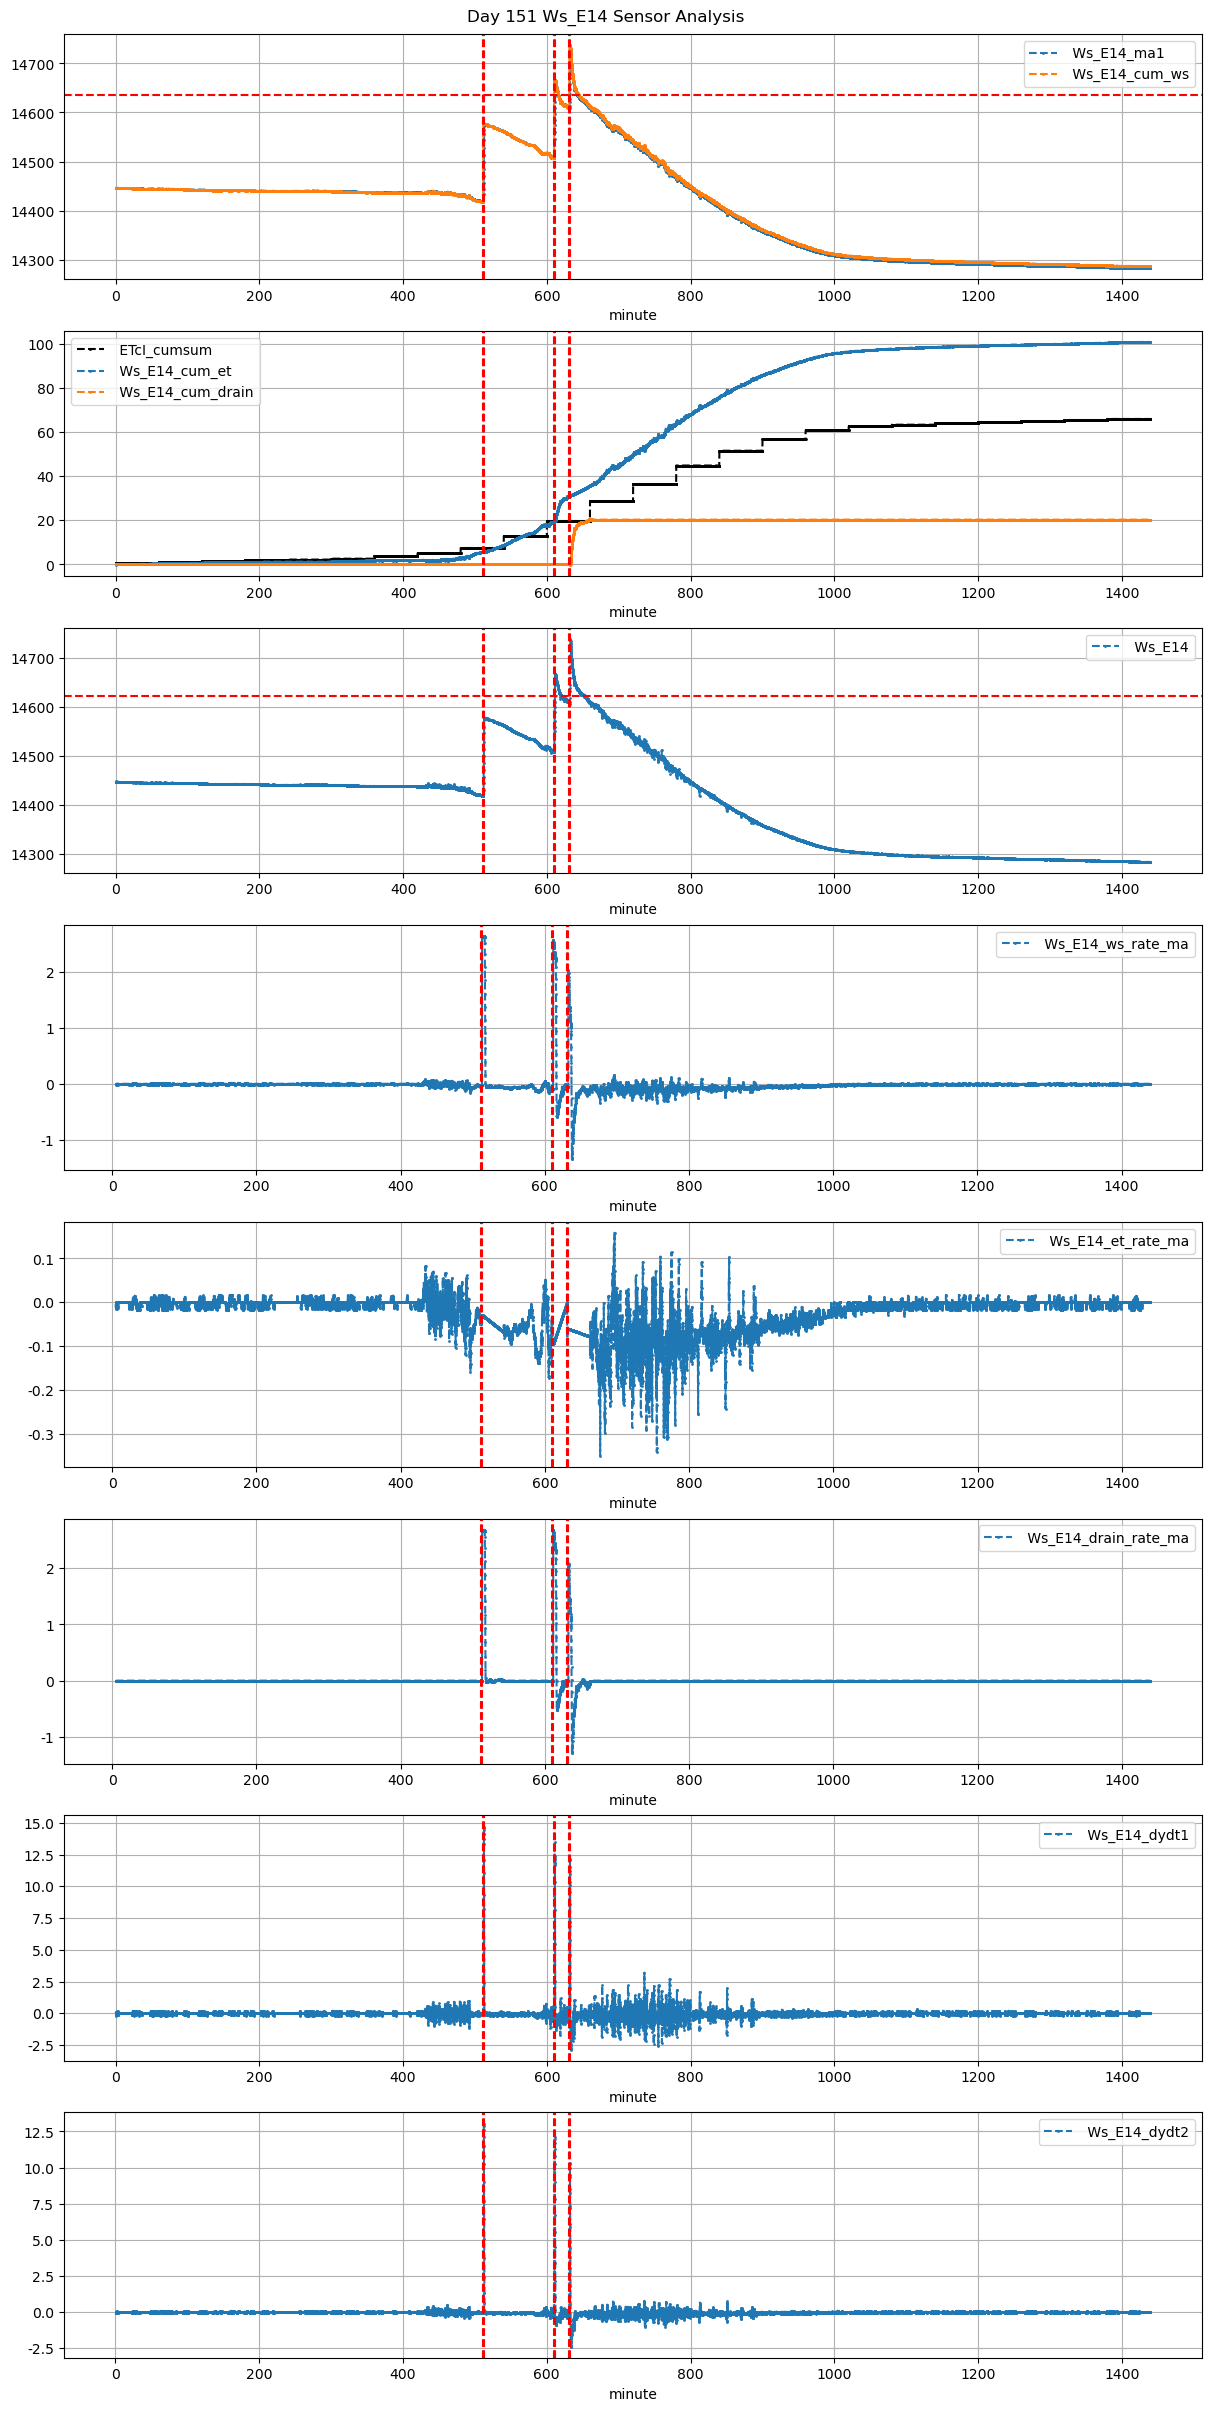
151 |
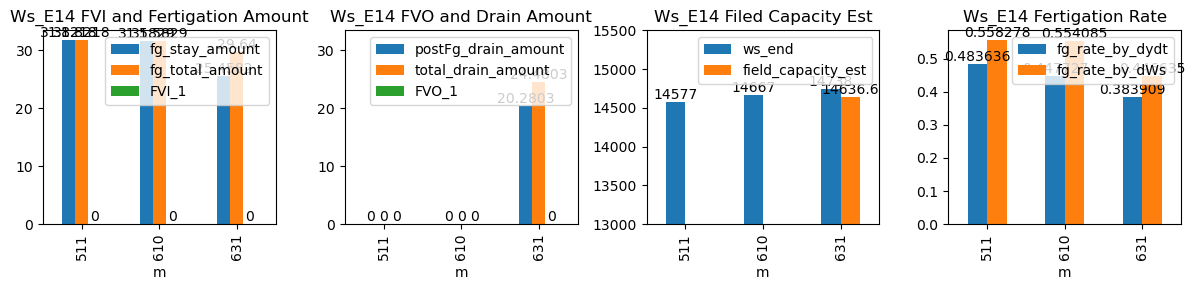
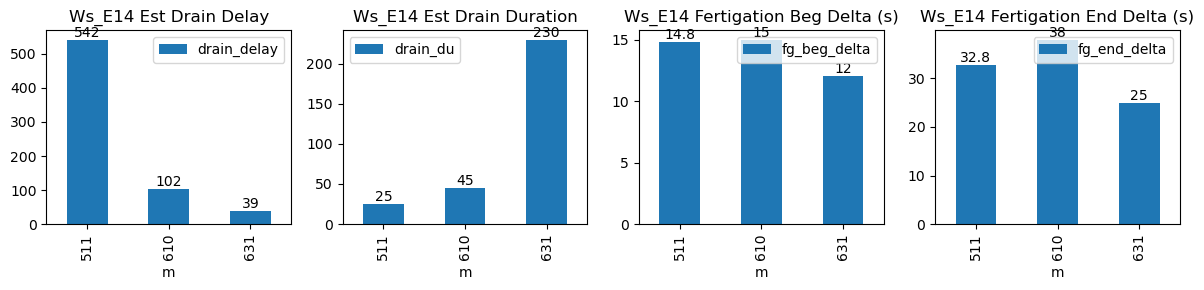
511 |
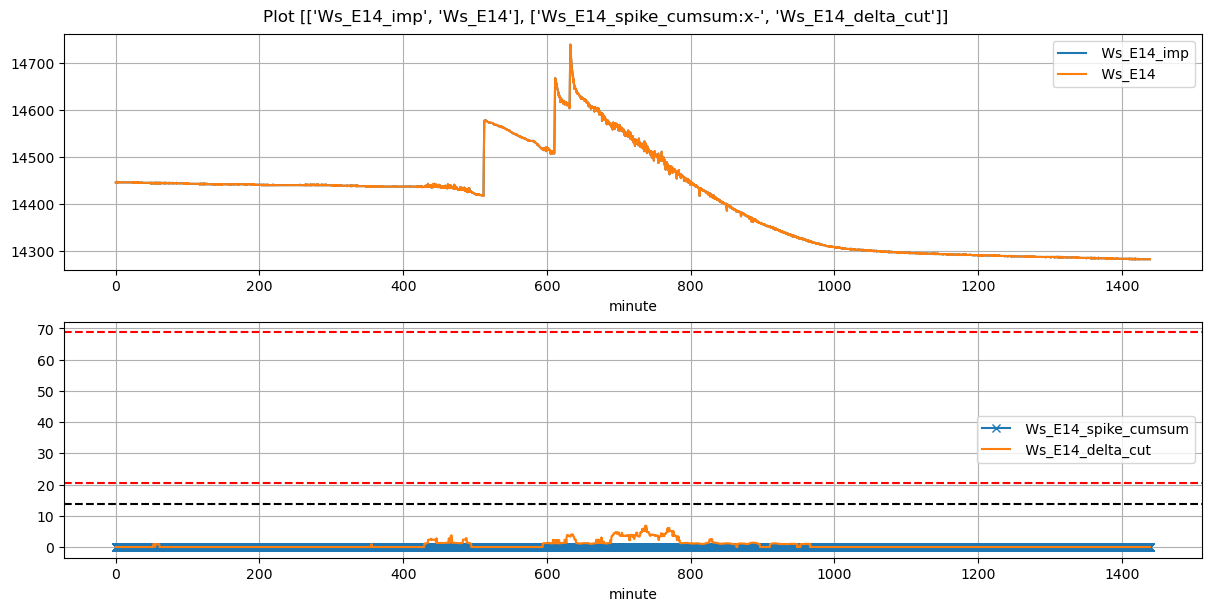
Ws_E14 |
0.612096 |
30.000000 |
511.42 |
511.666667 |
512.37 |
512.916667 |
14417.890909 |
14577.0 |
57 |
-0.029110 |
-0.052199 |
-0.067869 |
0.483636 |
0.558278 |
31.821818 |
True |
14.8 |
32.8 |
31.821818 |
0.0 |
0.000000 |
0.000000 |
25 |
542 |
-0.136952 |
NaN |
NaN |
NaN |
| 2026-03-06 10:10:00+08:00 |
151 |
610 |
Ws_E14 |
0.612096 |
19.416667 |
610.00 |
610.250000 |
610.95 |
611.583333 |
14509.085714 |
14667.0 |
57 |
-0.096022 |
-0.416111 |
0.000000 |
0.447727 |
0.554085 |
31.582857 |
True |
15.0 |
38.0 |
31.582857 |
0.0 |
0.000000 |
0.000000 |
45 |
102 |
-0.861677 |
NaN |
NaN |
NaN |
| 2026-03-06 10:31:18+08:00 |
151 |
631 |
Ws_E14 |
0.612096 |
30.000000 |
631.30 |
631.500000 |
632.25 |
632.666667 |
14610.709091 |
14738.0 |
57 |
-0.060486 |
-0.757454 |
-0.078310 |
0.383909 |
0.446635 |
25.458182 |
True |
12.0 |
25.0 |
29.640000 |
4.2 |
20.280308 |
24.480308 |
230 |
39 |
-1.838863 |
14636.598459 |
NaN |
NaN |