| 2026-02-24 08:21:19+08:00 |
141 |
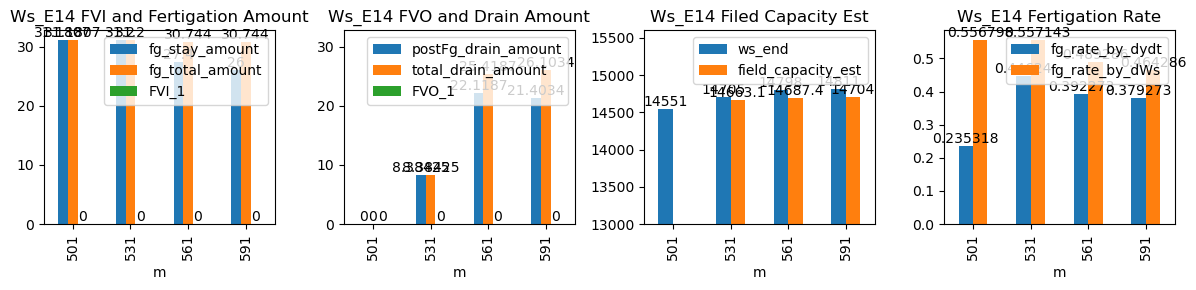
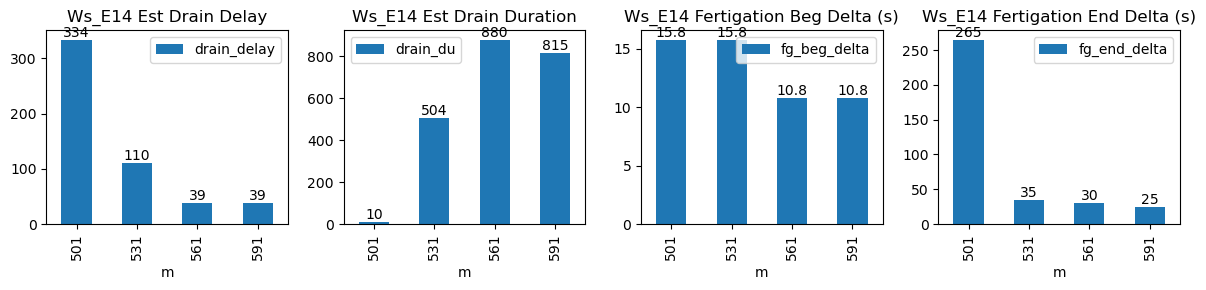
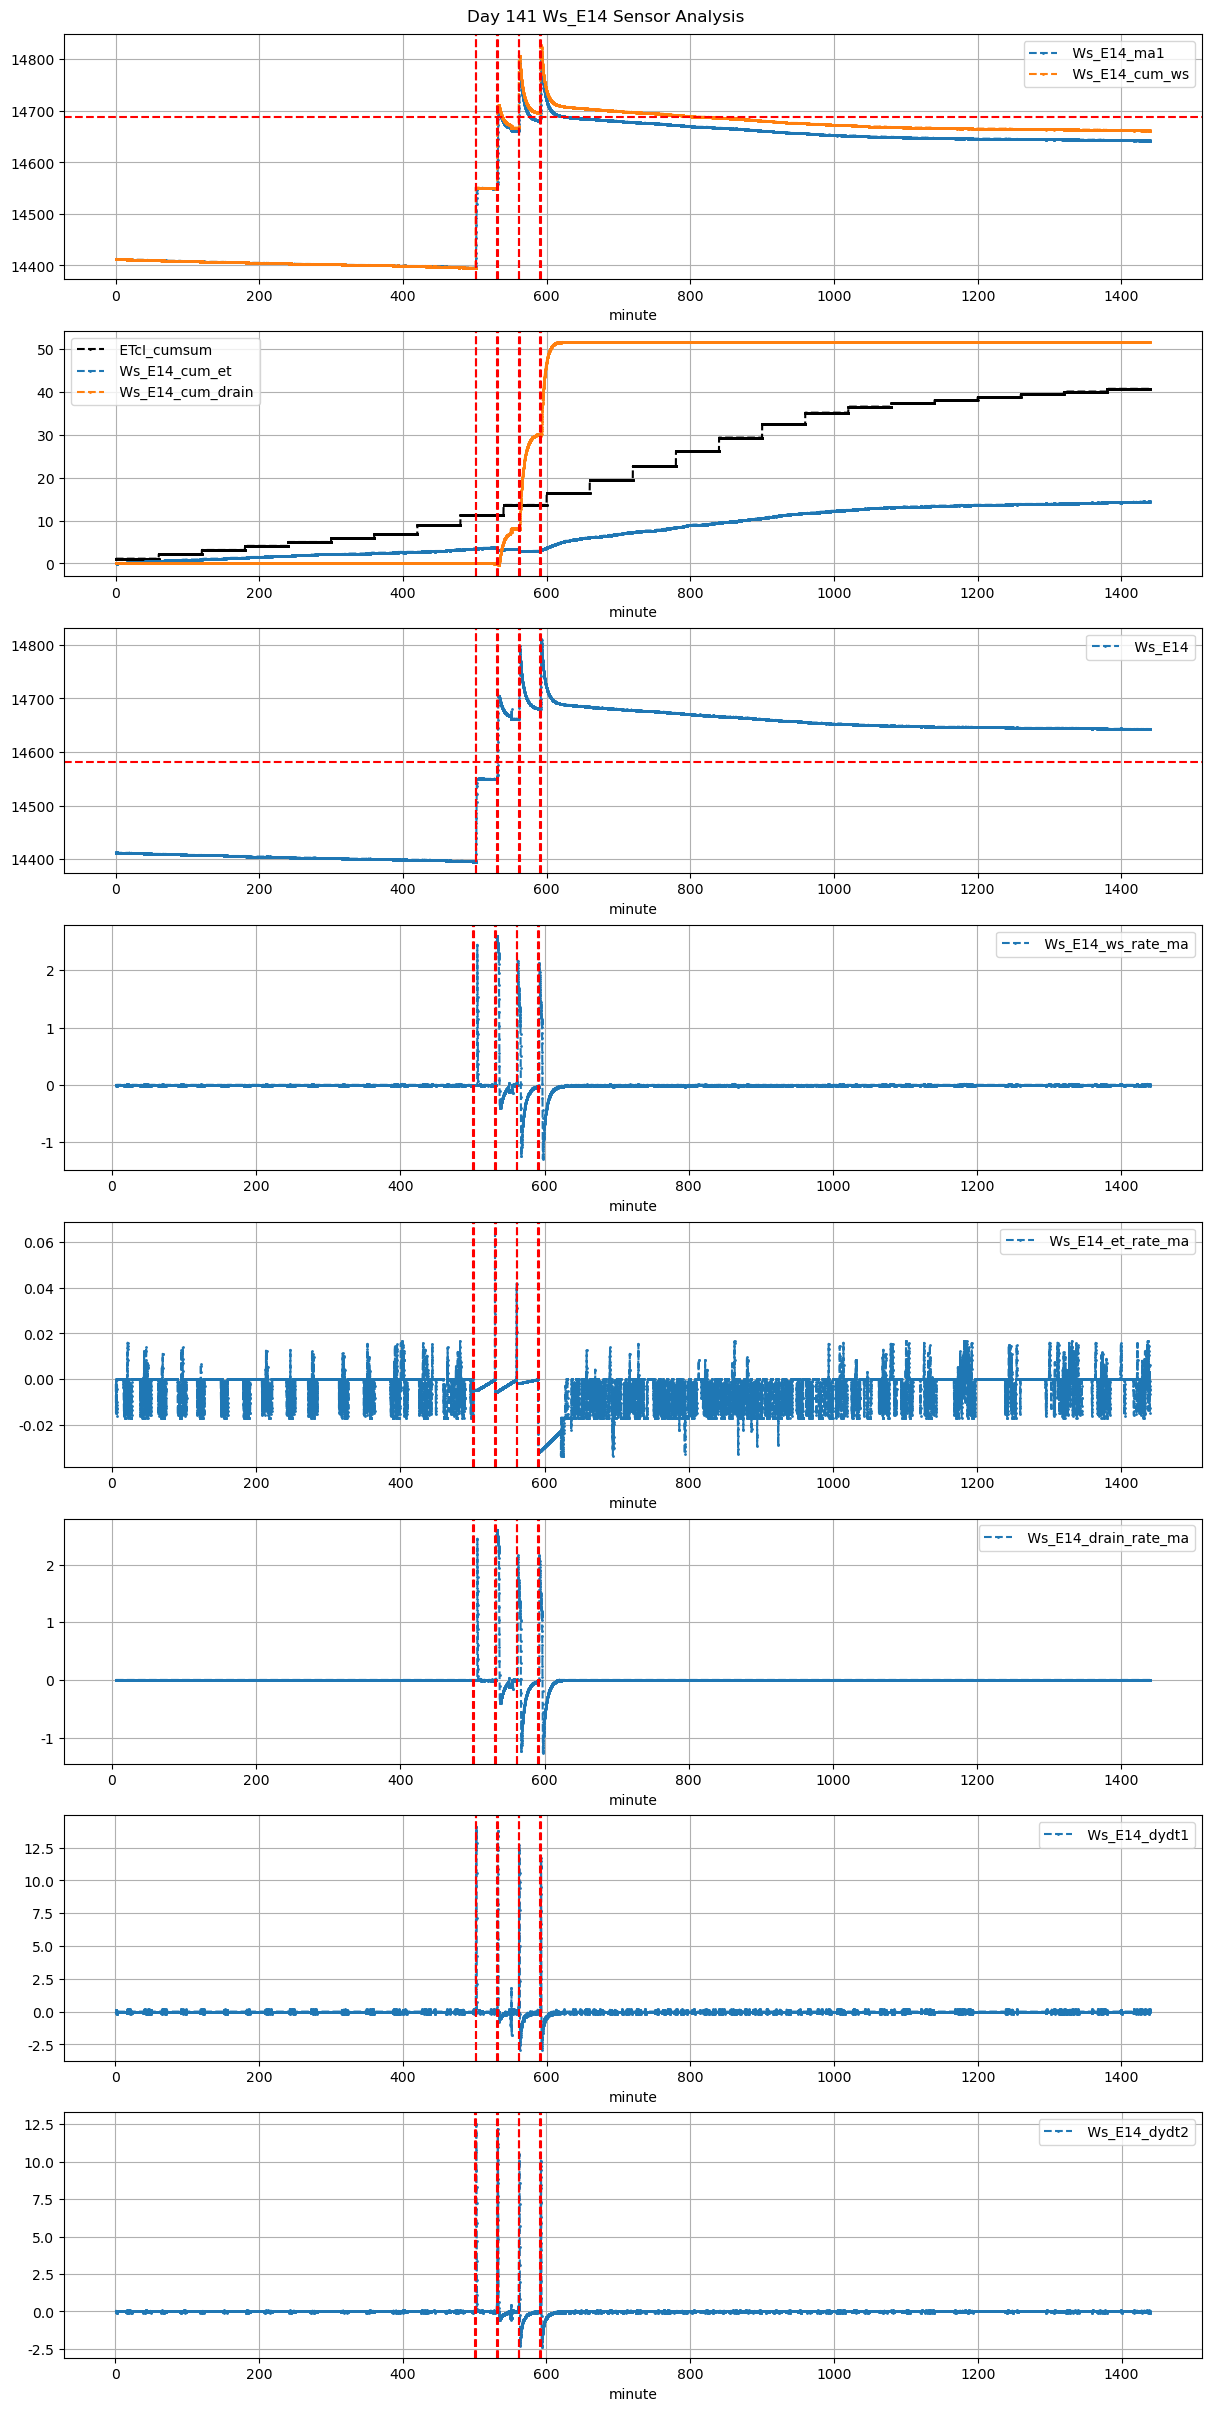
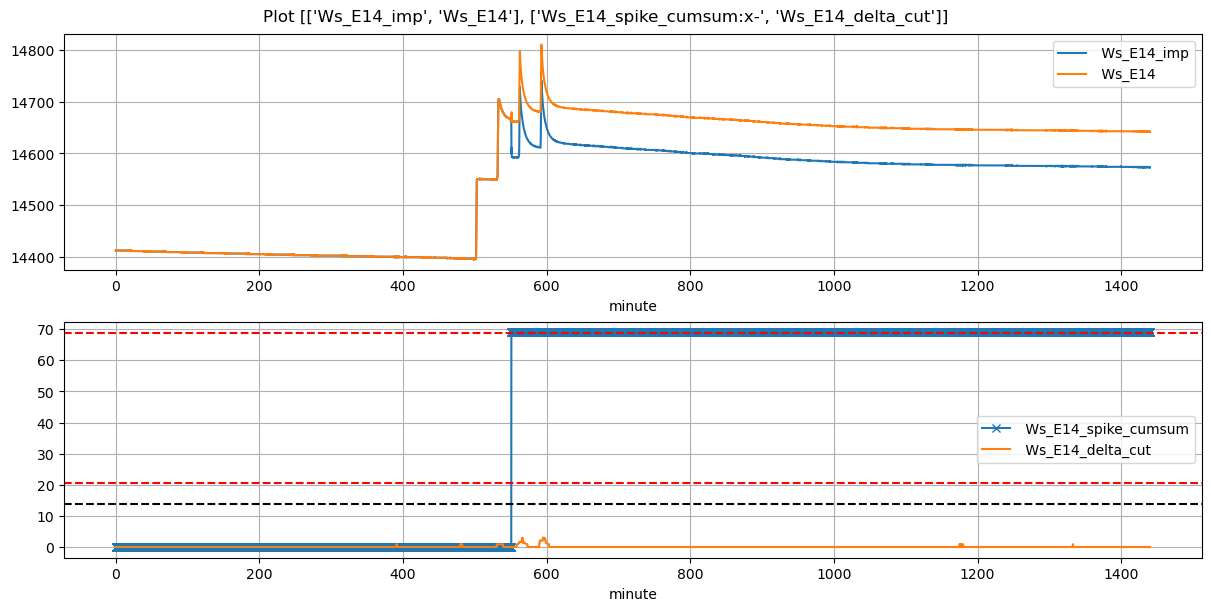
501 |
Ws_E14 |
0.593268 |
24.333333 |
501.32 |
501.583333 |
502.25 |
506.666667 |
14395.096667 |
14551.0 |
56 |
-0.008073 |
-0.004569 |
0.0000 |
0.235318 |
0.556798 |
31.180667 |
True |
15.8 |
265.0 |
31.180667 |
0.0 |
0.000000 |
0.000000 |
10 |
334 |
-0.161116 |
NaN |
NaN |
NaN |
| 2026-02-24 08:51:19+08:00 |
141 |
531 |
Ws_E14 |
0.593268 |
28.166667 |
531.32 |
531.583333 |
532.25 |
532.833333 |
14549.000000 |
14705.0 |
56 |
-0.005530 |
-0.305602 |
0.0000 |
0.446240 |
0.557143 |
31.200000 |
True |
15.8 |
35.0 |
31.200000 |
0.0 |
8.384251 |
8.384251 |
504 |
110 |
-0.602573 |
14663.078746 |
NaN |
NaN |
| 2026-02-24 09:21:19+08:00 |
141 |
561 |
Ws_E14 |
0.593268 |
28.250000 |
561.32 |
561.500000 |
562.25 |
562.750000 |
14661.000000 |
14798.0 |
56 |
-0.001818 |
-0.692593 |
0.0000 |
0.392273 |
0.489286 |
27.400000 |
True |
10.8 |
30.0 |
30.744000 |
3.3 |
22.118743 |
25.418743 |
880 |
39 |
-1.518261 |
14687.406283 |
NaN |
NaN |
| 2026-02-24 09:51:19+08:00 |
141 |
591 |
Ws_E14 |
0.593268 |
30.000000 |
591.32 |
591.500000 |
592.25 |
592.666667 |
14681.000000 |
14811.0 |
56 |
-0.031542 |
-0.743056 |
-0.0225 |
0.379273 |
0.464286 |
26.000000 |
True |
10.8 |
25.0 |
30.744000 |
4.7 |
21.403359 |
26.103359 |
815 |
39 |
-1.658897 |
14703.983206 |
NaN |
NaN |