VI and VO Daily Summary
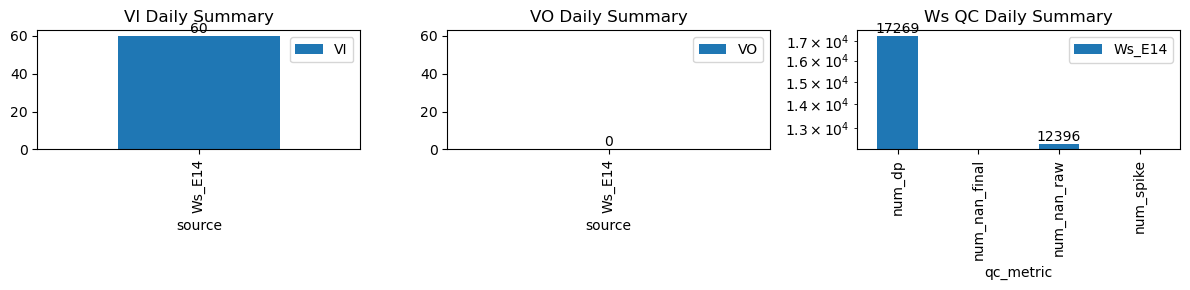
| ws_name | num_dp | num_nan_raw | num_nan_final | num_spike | cum_step_adj |
|---|---|---|---|---|---|
| Ws_E14 | 17,269 | 12,396 | 0 | 0 | 0.00 |
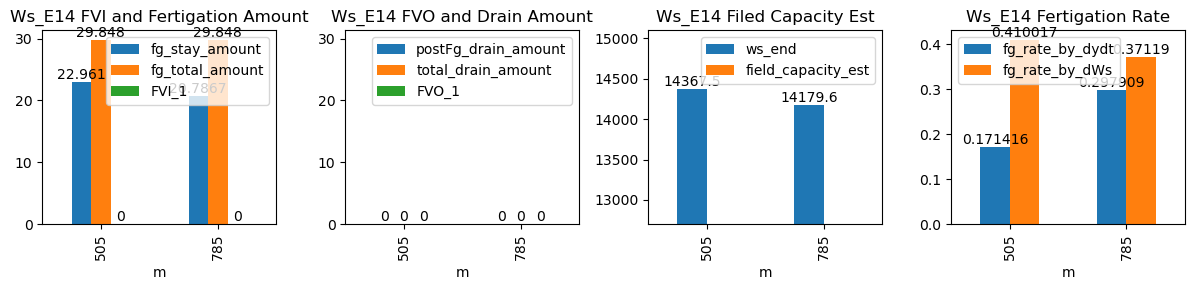
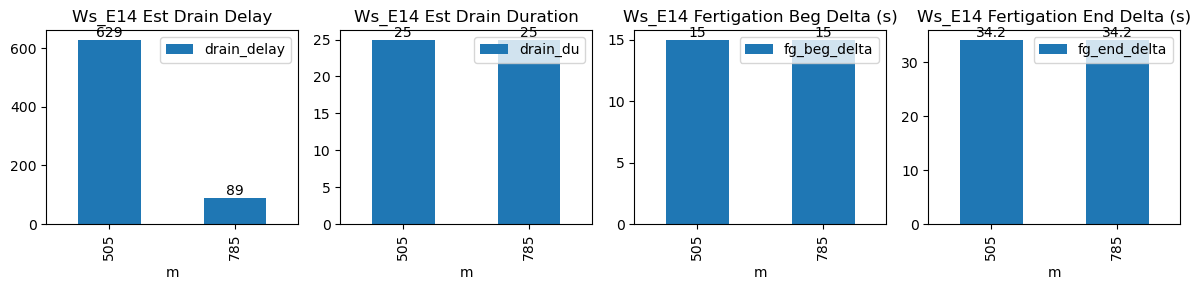
| ds | d | m | ws_name | prominence_cut | max_drain_du | fg_beg | fg_beg_est | fg_end | fg_end_est | ws_beg | ws_end | duc | pre_fg_et | post_fg_ws | post_drn_et | fg_rate_by_dydt | fg_rate_by_dWs | fg_stay_amount | enough_data | fg_beg_delta | fg_end_delta | fg_total_amount | fg_drain_amount | postFg_drain_amount | total_drain_amount | drain_du | drain_delay | drain_rate | field_capacity_est | FVI_1 | FVO_1 |
|---|---|---|---|---|---|---|---|---|---|---|---|---|---|---|---|---|---|---|---|---|---|---|---|---|---|---|---|---|---|---|---|
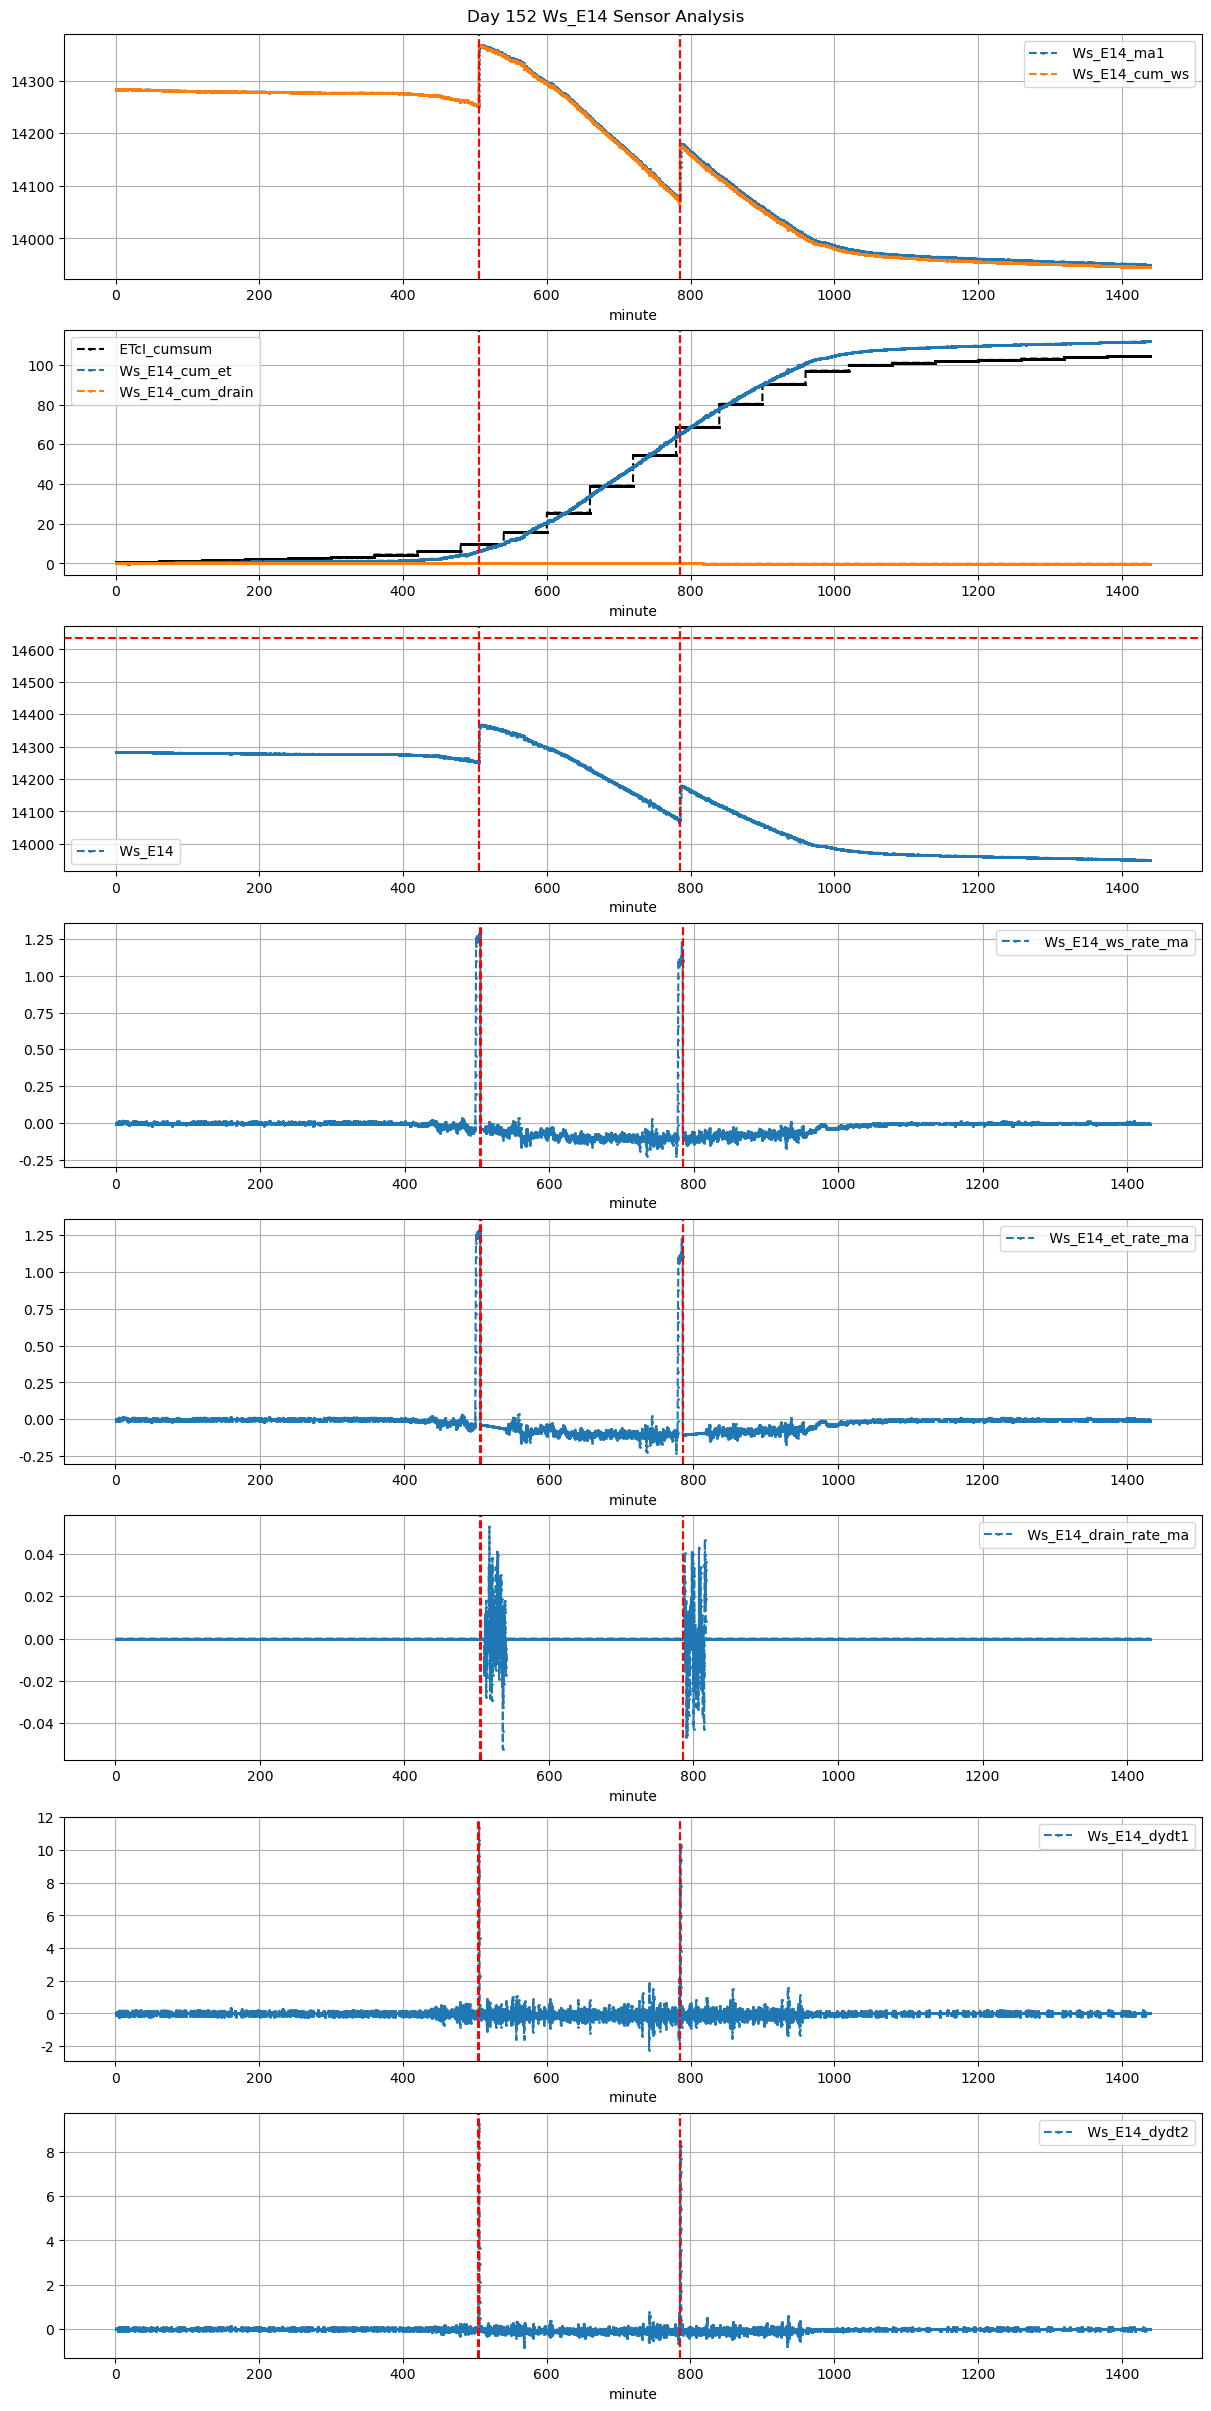
| 2026-03-07 08:25:00+08:00 | 152 | 505 | Ws_E14 | 0.361017 | 30 | 505.0 | 505.25 | 505.93 | 506.5 | 14252.471429 | 14368.0 | 56 | -0.043883 | -0.027130 | -0.046343 | 0.338182 | 0.412602 | 23.105714 | True | 15.0 | 34.2 | 29.792 | 0.0 | 0 | 0.0 | 25 | 629 | -0.587064 | NaN | NaN | NaN |
| 2026-03-07 13:05:00+08:00 | 152 | 785 | Ws_E14 | 0.361017 | 30 | 785.0 | 785.25 | 785.93 | 786.5 | 14075.000000 | 14180.0 | 56 | -0.108781 | -0.093704 | -0.099259 | 0.313636 | 0.375000 | 21.000000 | True | 15.0 | 34.2 | 29.792 | 0.0 | 0 | 0.0 | 25 | 89 | -0.455097 | NaN | NaN | NaN |