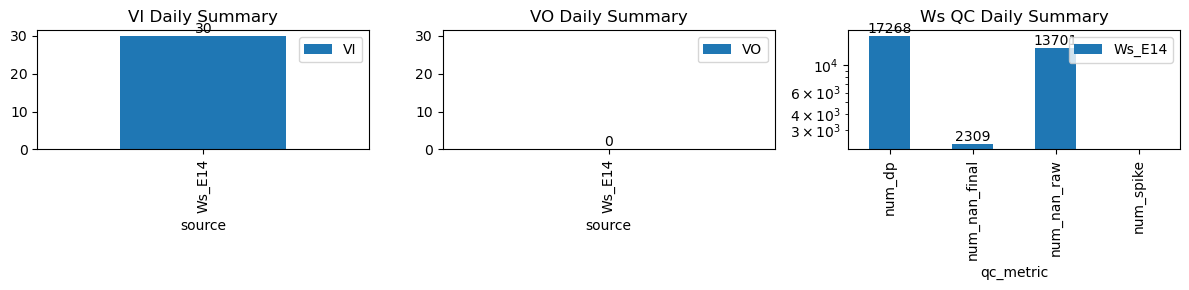
VI and VO Daily Summary
| ws_name | num_dp | num_nan_raw | num_nan_final | num_spike | cum_step_adj |
|---|---|---|---|---|---|
| Ws_E14 | 17,268 | 13,701 | 2,309 | 0 | 0.00 |
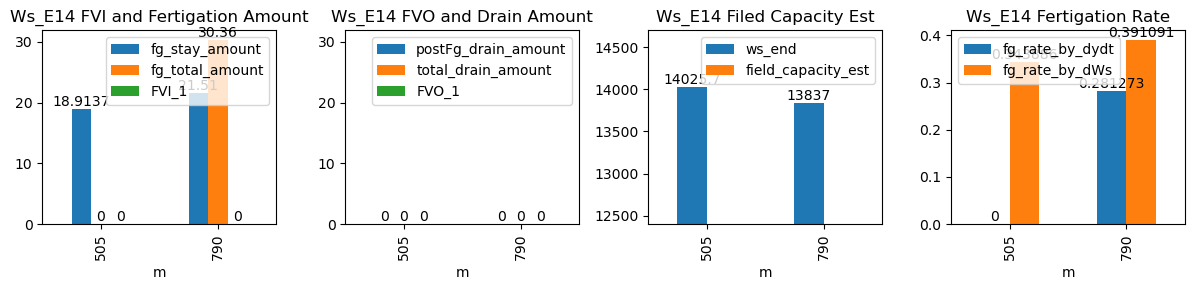
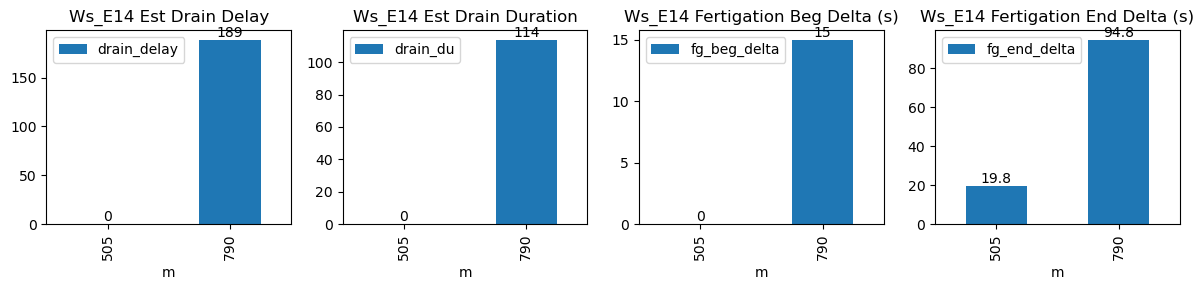
| ds | d | m | ws_name | prominence_cut | max_drain_du | fg_beg | fg_beg_est | fg_end | fg_end_est | ws_beg | ws_end | duc | pre_fg_et | post_fg_ws | post_drn_et | fg_rate_by_dydt | fg_rate_by_dWs | fg_stay_amount | enough_data | fg_beg_delta | fg_end_delta | fg_total_amount | fg_drain_amount | postFg_drain_amount | total_drain_amount | drain_du | drain_delay | drain_rate | field_capacity_est | FVI_1 | FVO_1 |
|---|---|---|---|---|---|---|---|---|---|---|---|---|---|---|---|---|---|---|---|---|---|---|---|---|---|---|---|---|---|---|---|
| 2026-03-08 08:25:00+08:00 | 153 | 505 | Ws_E14 | 0.30544 | 30 | 505.0 | NaN | 505.92 | 506.416667 | NaN | 14045.0 | 55 | NaN | NaN | NaN | NaN | NaN | NaN | False | NaN | 29.8 | NaN | NaN | NaN | NaN | NaN | NaN | NaN | NaN | NaN | NaN |
| 2026-03-08 13:10:00+08:00 | 153 | 790 | Ws_E14 | 0.30544 | 30 | 790.0 | 790.25 | 790.92 | 791.416667 | 13729.0 | 13837.0 | 55 | -0.119562 | -0.101944 | -0.107264 | 0.328091 | 0.392727 | 21.6 | True | 15.0 | 29.8 | 30.36 | 0.0 | 0.0 | 0.0 | 25.0 | 269.0 | -0.244566 | NaN | NaN | NaN |