| 2026-02-26 08:09:16+08:00 |
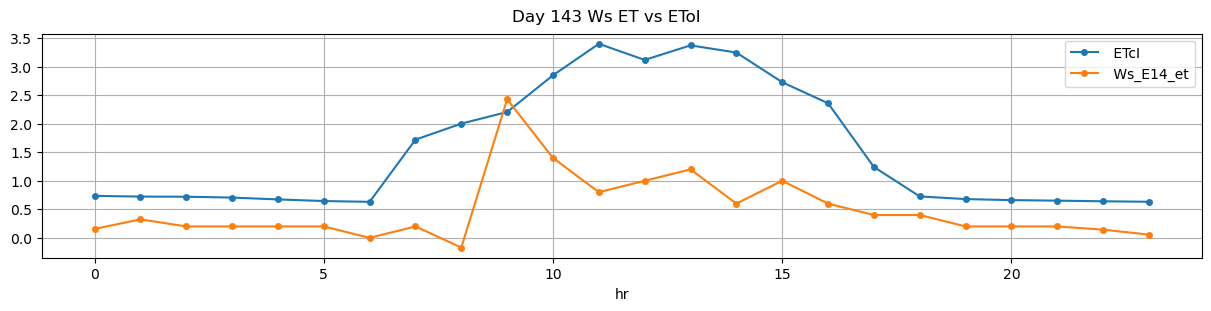
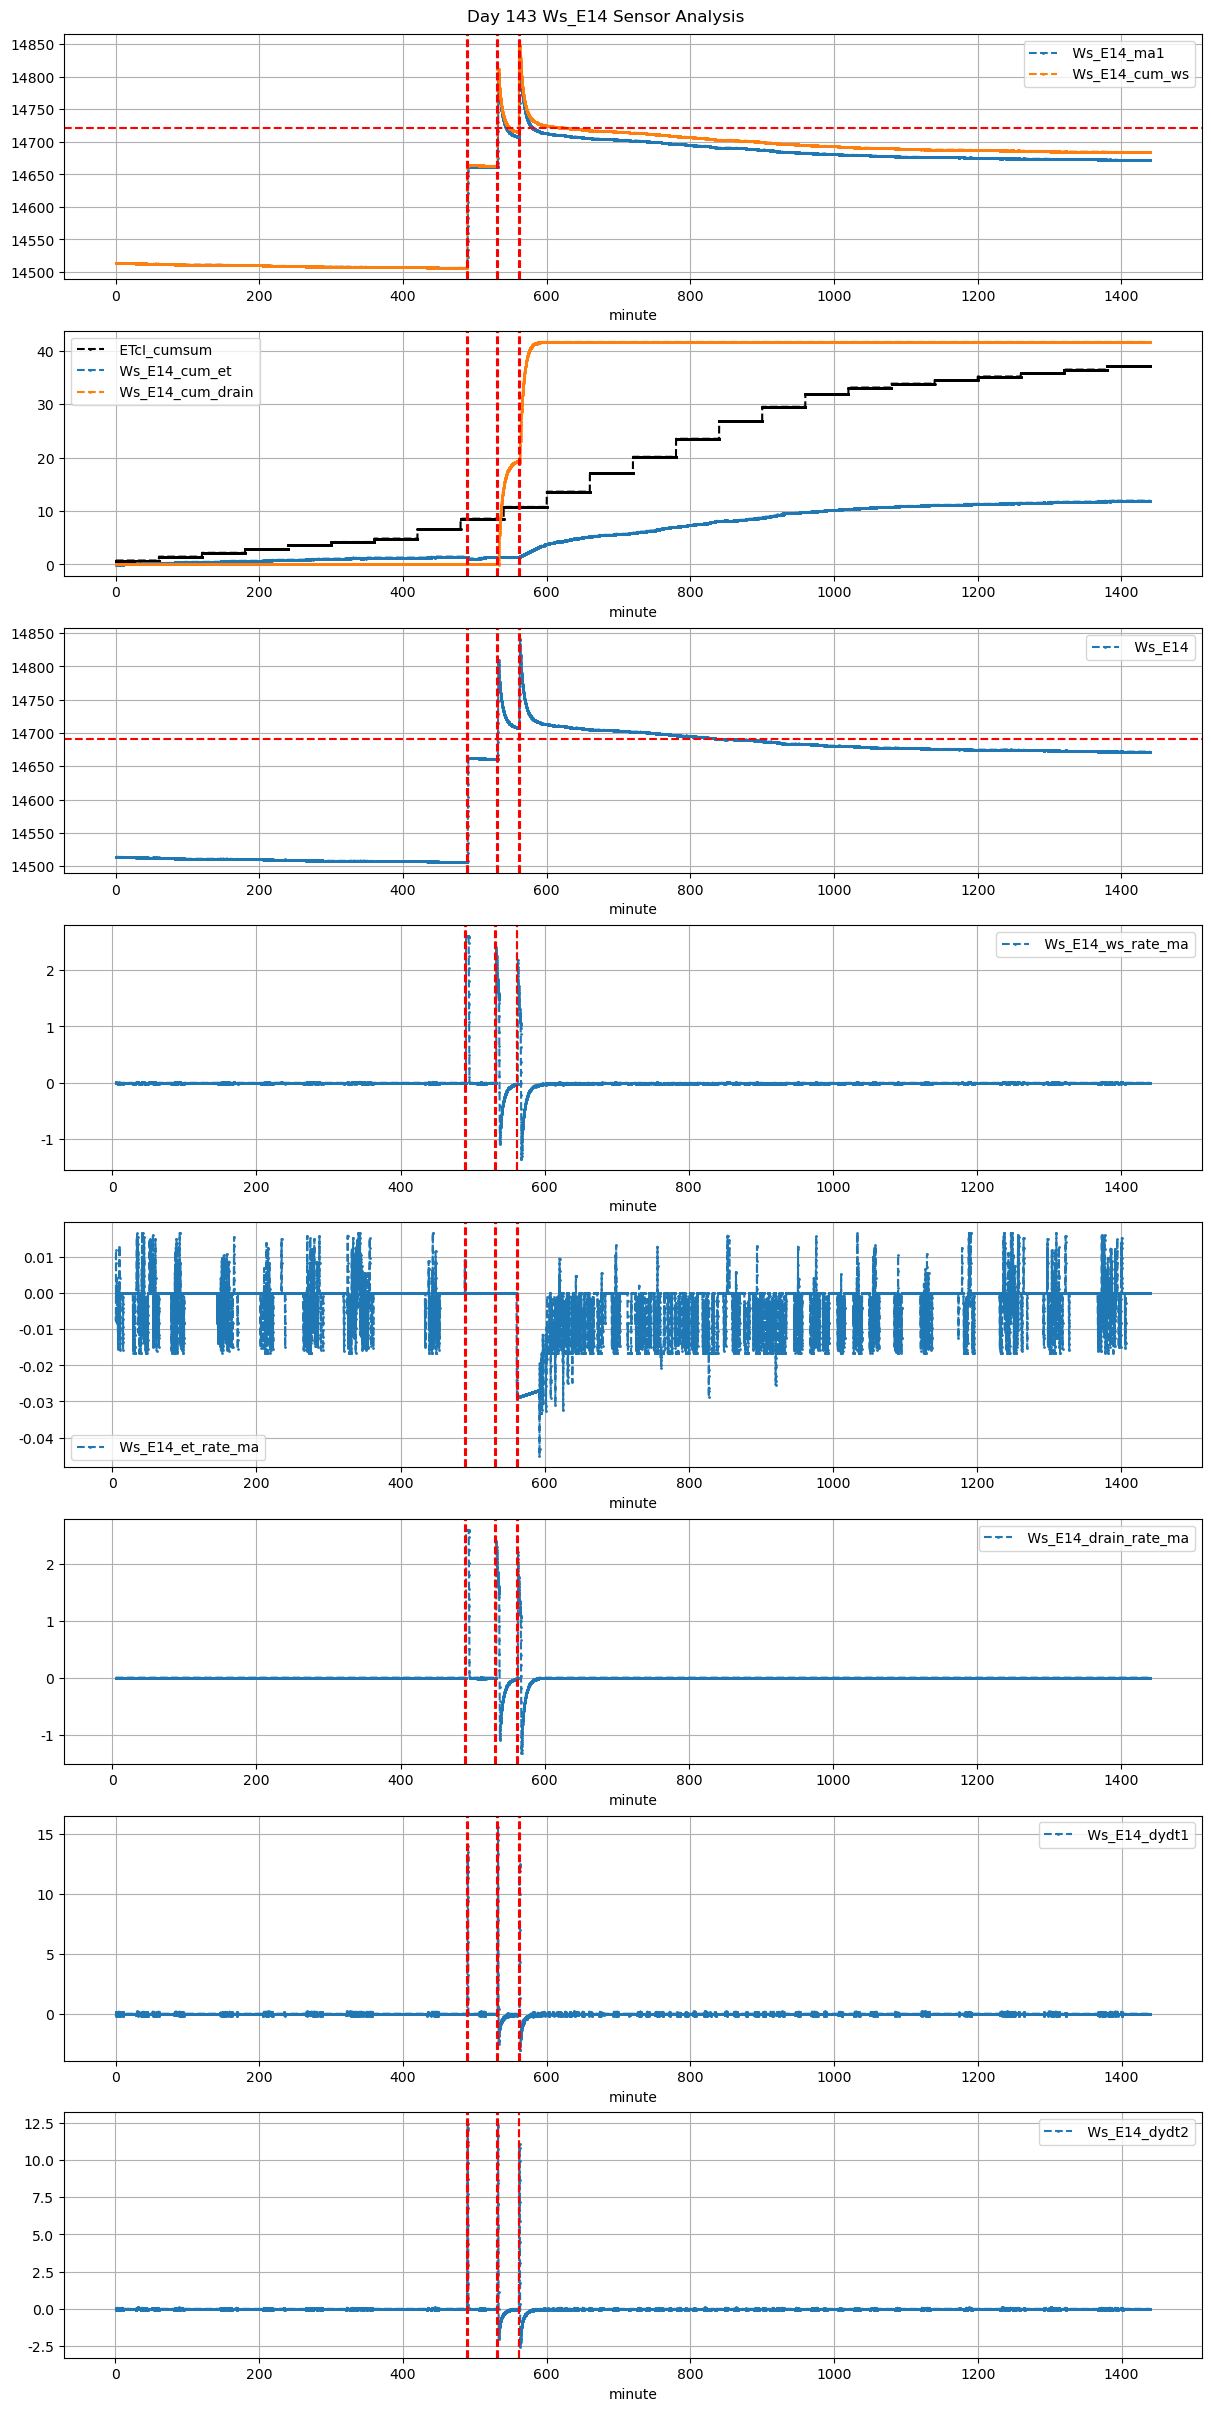
143 |
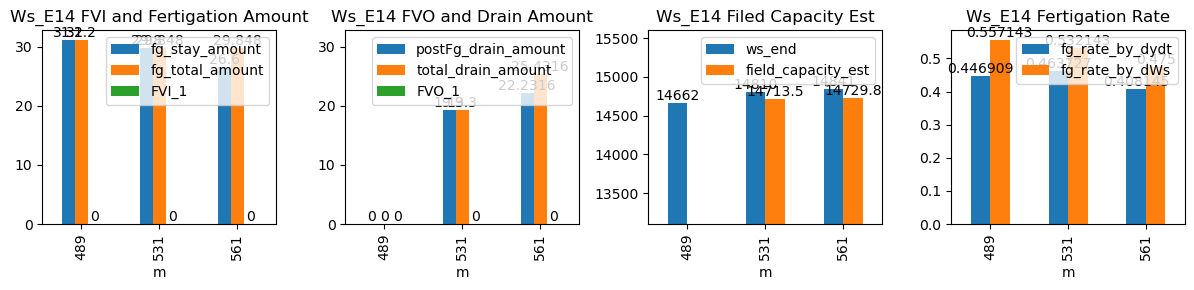
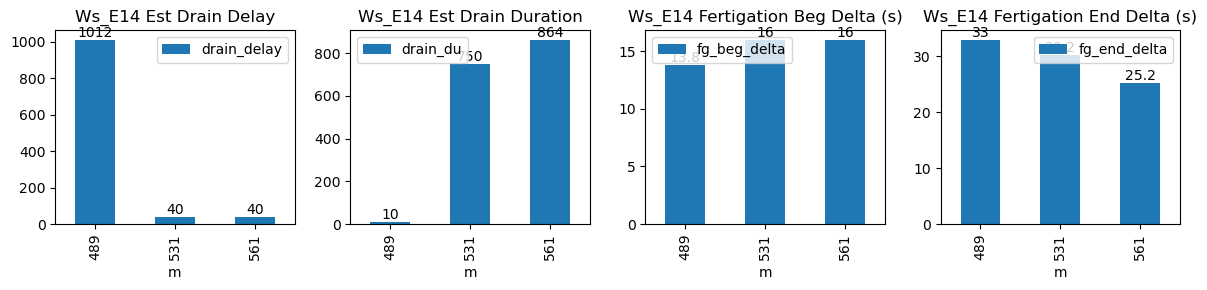
489 |
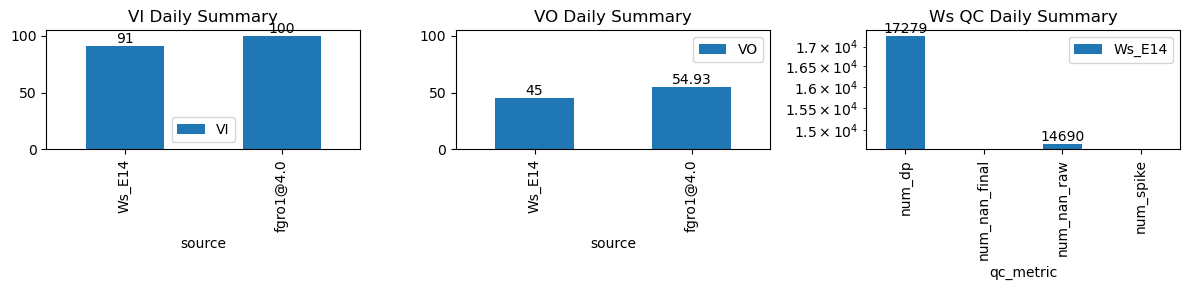
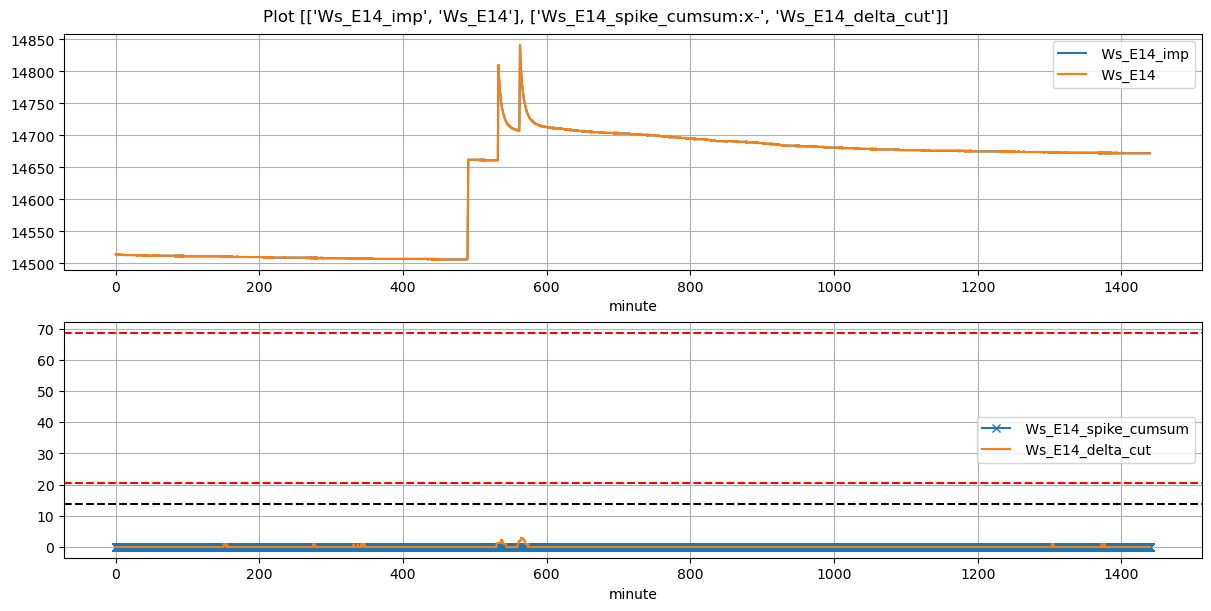
Ws_E14 |
0.548606 |
30.000000 |
489.27 |
489.500000 |
490.20 |
490.750000 |
14506.0 |
14662.0 |
56 |
0.000000 |
0.000000 |
0.000000 |
0.446909 |
0.557143 |
31.2 |
True |
13.8 |
33.0 |
31.200 |
0.0 |
0.000000 |
0.000000 |
10 |
1012 |
-0.165810 |
NaN |
NaN |
NaN |
| 2026-02-26 08:51:24+08:00 |
143 |
531 |
Ws_E14 |
0.548606 |
28.166667 |
531.40 |
531.666667 |
532.33 |
532.833333 |
14661.0 |
14810.0 |
56 |
0.000000 |
-0.605463 |
0.000000 |
0.463727 |
0.532143 |
29.8 |
True |
16.0 |
30.2 |
29.848 |
0.0 |
19.300000 |
19.300000 |
750 |
40 |
-1.400000 |
14713.500000 |
NaN |
NaN |
| 2026-02-26 09:21:24+08:00 |
143 |
561 |
Ws_E14 |
0.548606 |
30.000000 |
561.40 |
561.666667 |
562.33 |
562.750000 |
14708.0 |
14841.0 |
56 |
-0.028792 |
-0.749352 |
-0.026843 |
0.408145 |
0.475000 |
26.6 |
True |
16.0 |
25.2 |
29.848 |
3.2 |
22.231567 |
25.431567 |
864 |
40 |
-1.601307 |
14729.842164 |
NaN |
NaN |