| 2026-03-16 08:16:25+08:00 |
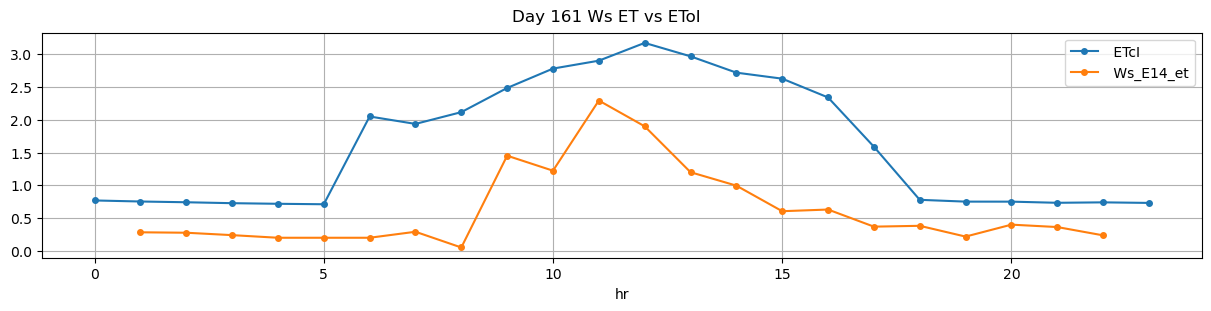
161 |
496 |
Ws_E14 |
0.446119 |
30 |
496.42 |
496.750000 |
497.32 |
501.666667 |
14243.0 |
14395.500000 |
54 |
0.000000 |
-0.000271 |
-0.006962 |
0.238417 |
0.564815 |
30.500000 |
True |
19.8 |
260.8 |
30.500 |
0.0 |
0.000000 |
0.000000 |
15 |
1295 |
-0.127980 |
NaN |
NaN |
NaN |
| 2026-03-16 09:01:25+08:00 |
161 |
541 |
Ws_E14 |
0.446119 |
30 |
541.42 |
541.750000 |
542.32 |
542.833333 |
14394.0 |
14537.333333 |
54 |
-0.000394 |
-0.521933 |
-0.020278 |
0.449533 |
0.530864 |
28.666667 |
True |
19.8 |
30.8 |
30.024 |
1.4 |
17.223413 |
18.623413 |
804 |
40 |
-0.998718 |
14451.216271 |
NaN |
NaN |
| 2026-03-16 11:04:08+08:00 |
161 |
664 |
Ws_E14 |
0.446119 |
30 |
664.13 |
664.416667 |
665.03 |
665.500000 |
14433.0 |
14569.000000 |
54 |
-0.008461 |
-0.591569 |
-0.027407 |
0.428900 |
0.503704 |
27.200000 |
True |
17.2 |
28.2 |
30.024 |
2.8 |
19.237716 |
22.037716 |
1000 |
38 |
-1.163099 |
14472.811418 |
NaN |
NaN |