| 2026-03-12 08:20:00+08:00 |
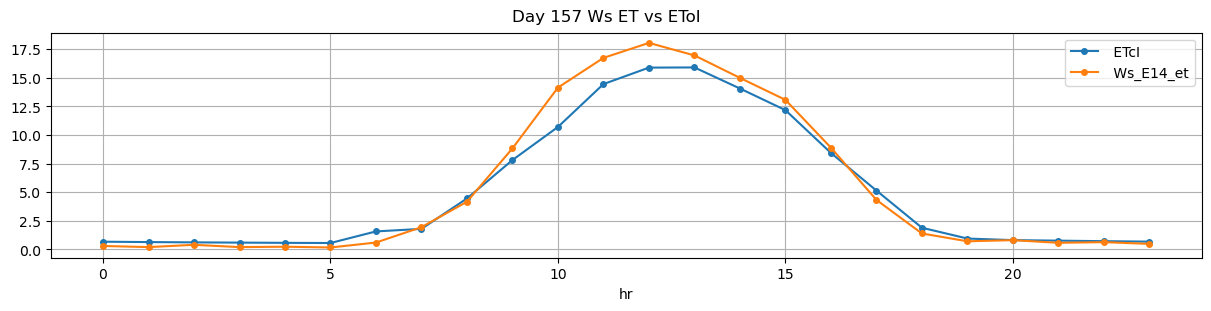
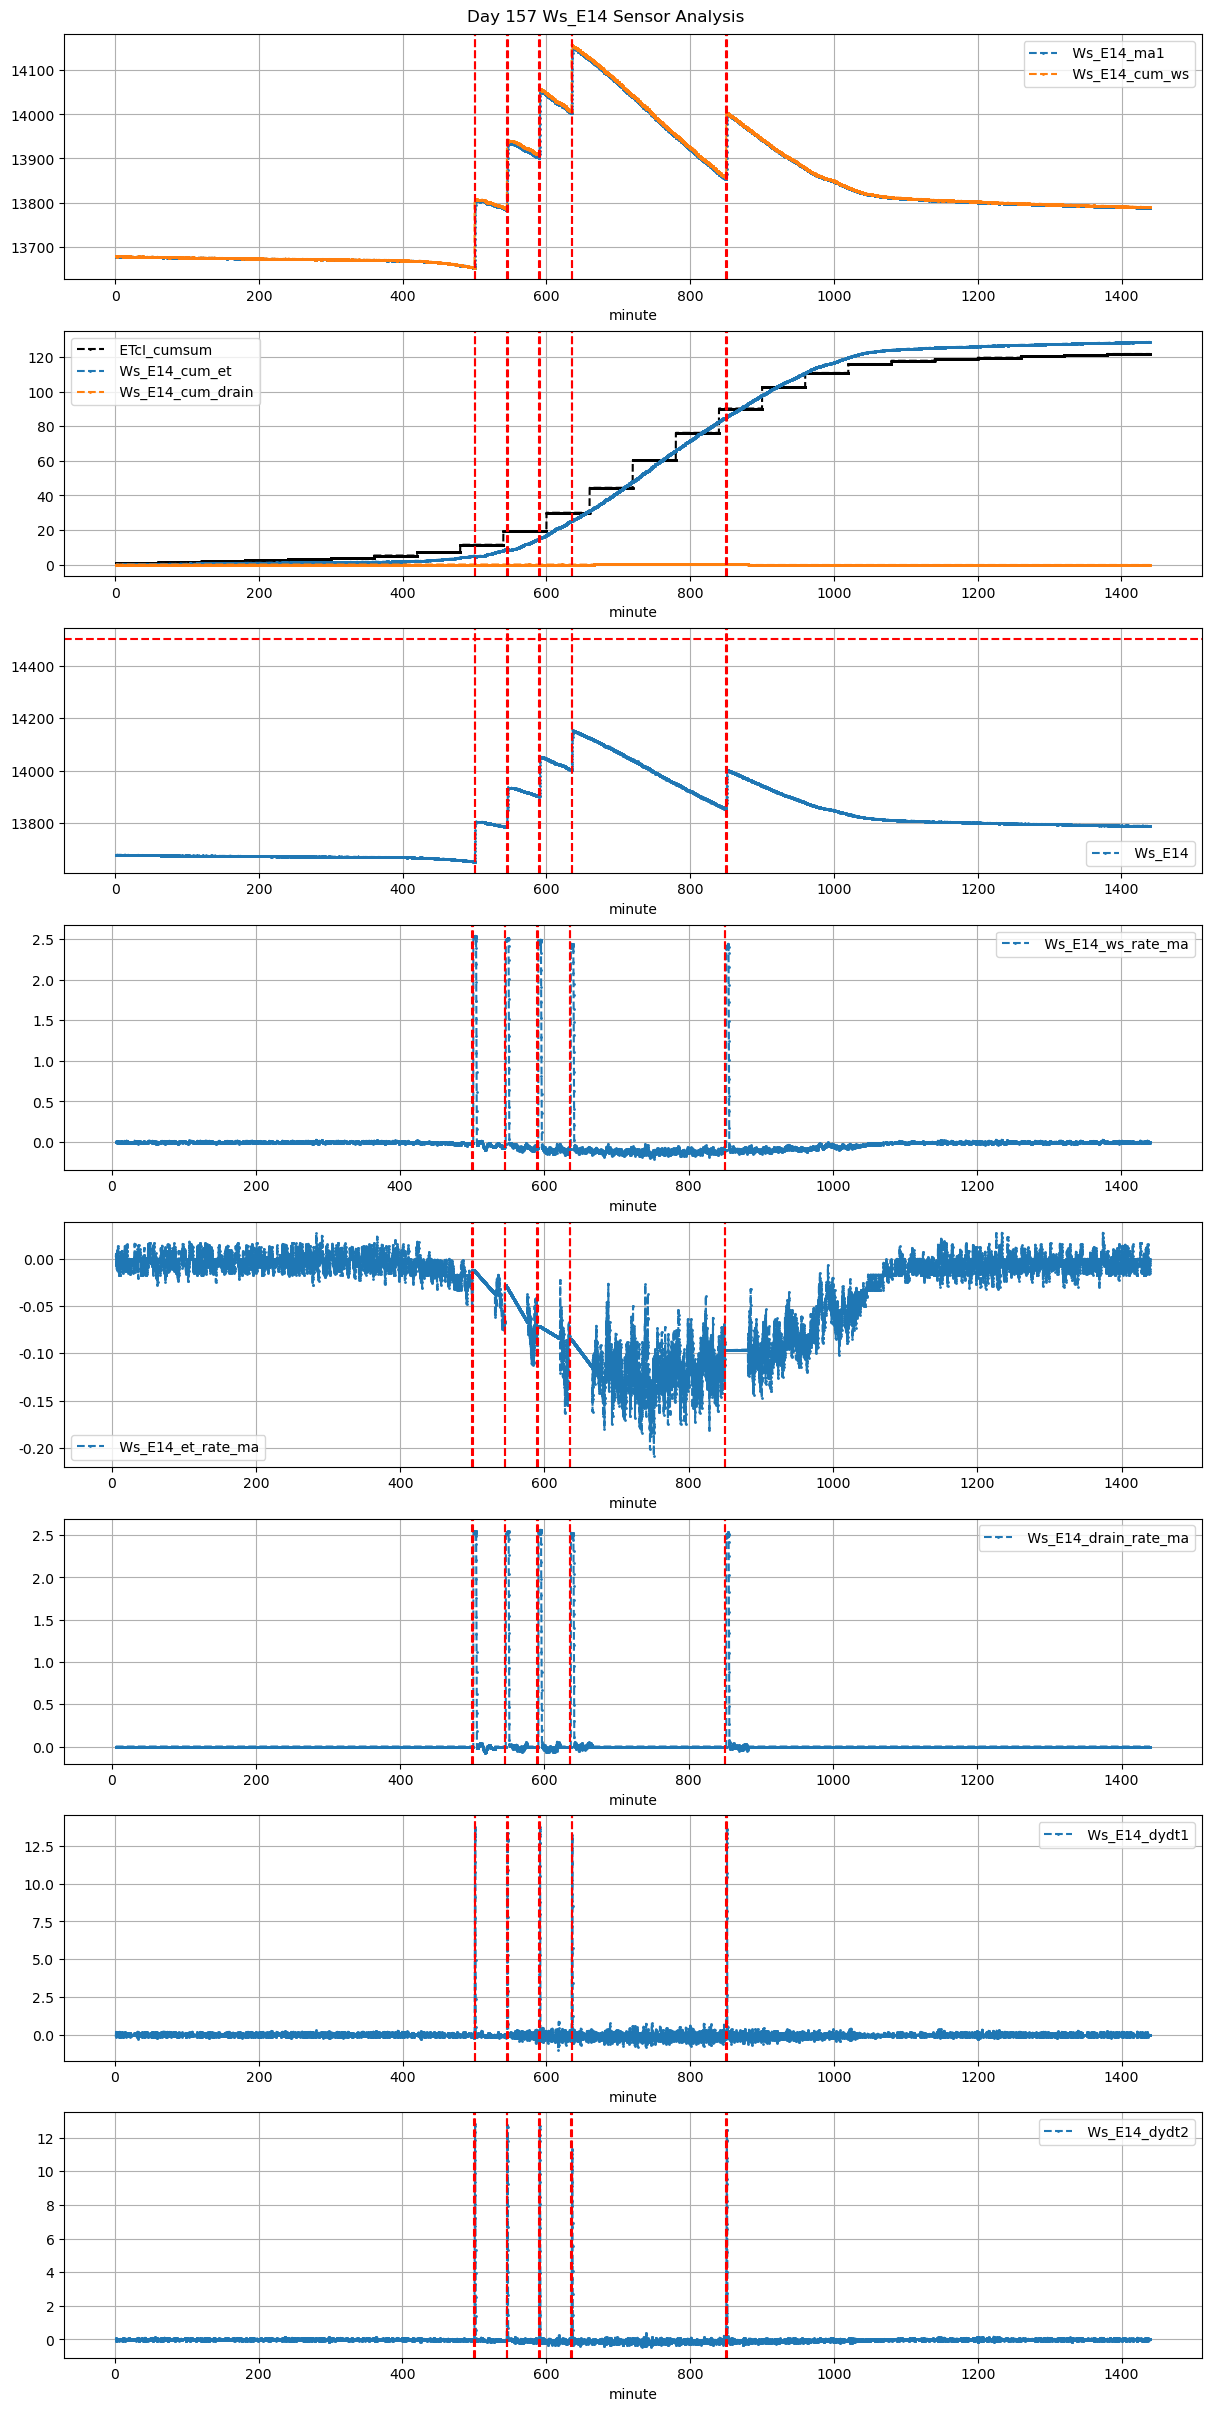
157 |
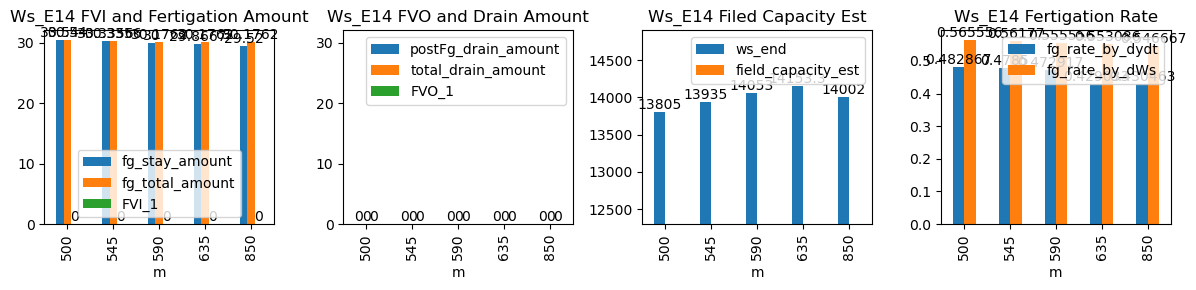
500 |
Ws_E14 |
0.333118 |
30 |
500.0 |
500.333333 |
500.9 |
501.416667 |
13652.300000 |
13805.000000 |
54 |
-0.025447 |
-0.011427 |
-0.037136 |
0.482867 |
0.565556 |
30.540000 |
True |
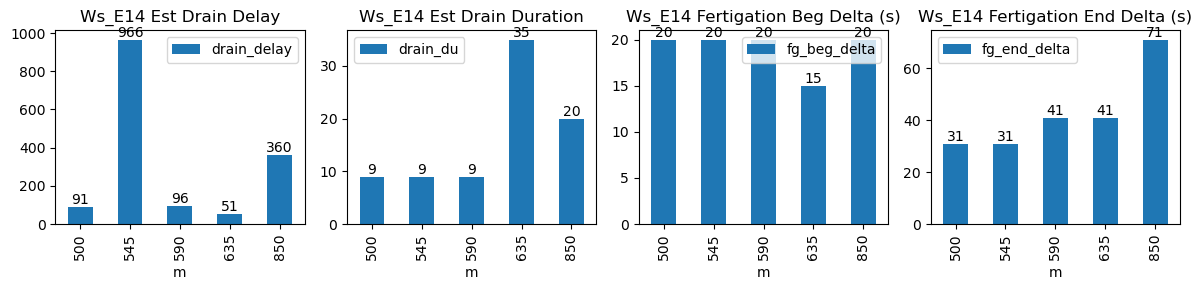
20.0 |
31.0 |
30.540000 |
0.0 |
0 |
0.0 |
9 |
91 |
-0.138053 |
NaN |
NaN |
NaN |
| 2026-03-12 09:05:00+08:00 |
157 |
545 |
Ws_E14 |
0.333118 |
30 |
545.0 |
545.333333 |
545.9 |
546.416667 |
13783.322222 |
13935.000000 |
54 |
-0.065912 |
-0.028009 |
-0.067130 |
0.478500 |
0.561770 |
30.335556 |
True |
20.0 |
31.0 |
30.335556 |
0.0 |
0 |
0.0 |
9 |
966 |
-0.241250 |
NaN |
NaN |
NaN |
| 2026-03-12 09:50:00+08:00 |
157 |
590 |
Ws_E14 |
0.333118 |
30 |
590.0 |
590.333333 |
590.9 |
591.583333 |
13903.000000 |
14053.000000 |
54 |
-0.070574 |
-0.079803 |
-0.084259 |
0.472917 |
0.555556 |
30.000000 |
True |
20.0 |
41.0 |
30.176182 |
0.0 |
0 |
0.0 |
9 |
96 |
-0.384324 |
NaN |
NaN |
NaN |
| 2026-03-12 10:35:00+08:00 |
157 |
635 |
Ws_E14 |
0.333118 |
30 |
635.0 |
635.250000 |
635.9 |
636.583333 |
14004.000000 |
14153.333333 |
54 |
-0.109320 |
-0.084597 |
-0.115046 |
0.429033 |
0.553086 |
29.866667 |
True |
15.0 |
41.0 |
30.176182 |
0.0 |
0 |
0.0 |
35 |
51 |
-0.390145 |
NaN |
NaN |
NaN |
| 2026-03-12 14:10:00+08:00 |
157 |
850 |
Ws_E14 |
0.333118 |
30 |
850.0 |
850.333333 |
850.9 |
852.083333 |
13854.400000 |
14002.000000 |
54 |
-0.096751 |
-0.099773 |
-0.095949 |
0.430463 |
0.546667 |
29.520000 |
True |
20.0 |
71.0 |
30.176182 |
0.0 |
0 |
0.0 |
20 |
360 |
-0.353828 |
NaN |
NaN |
NaN |