| 2026-02-28 08:09:25+08:00 |
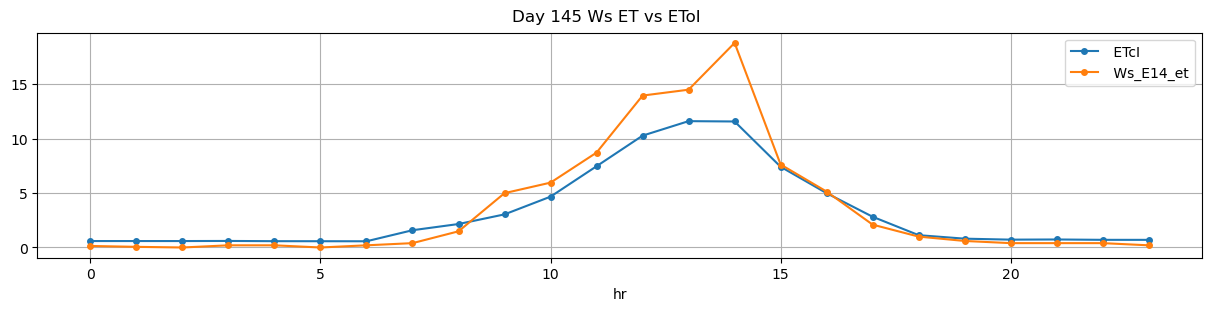
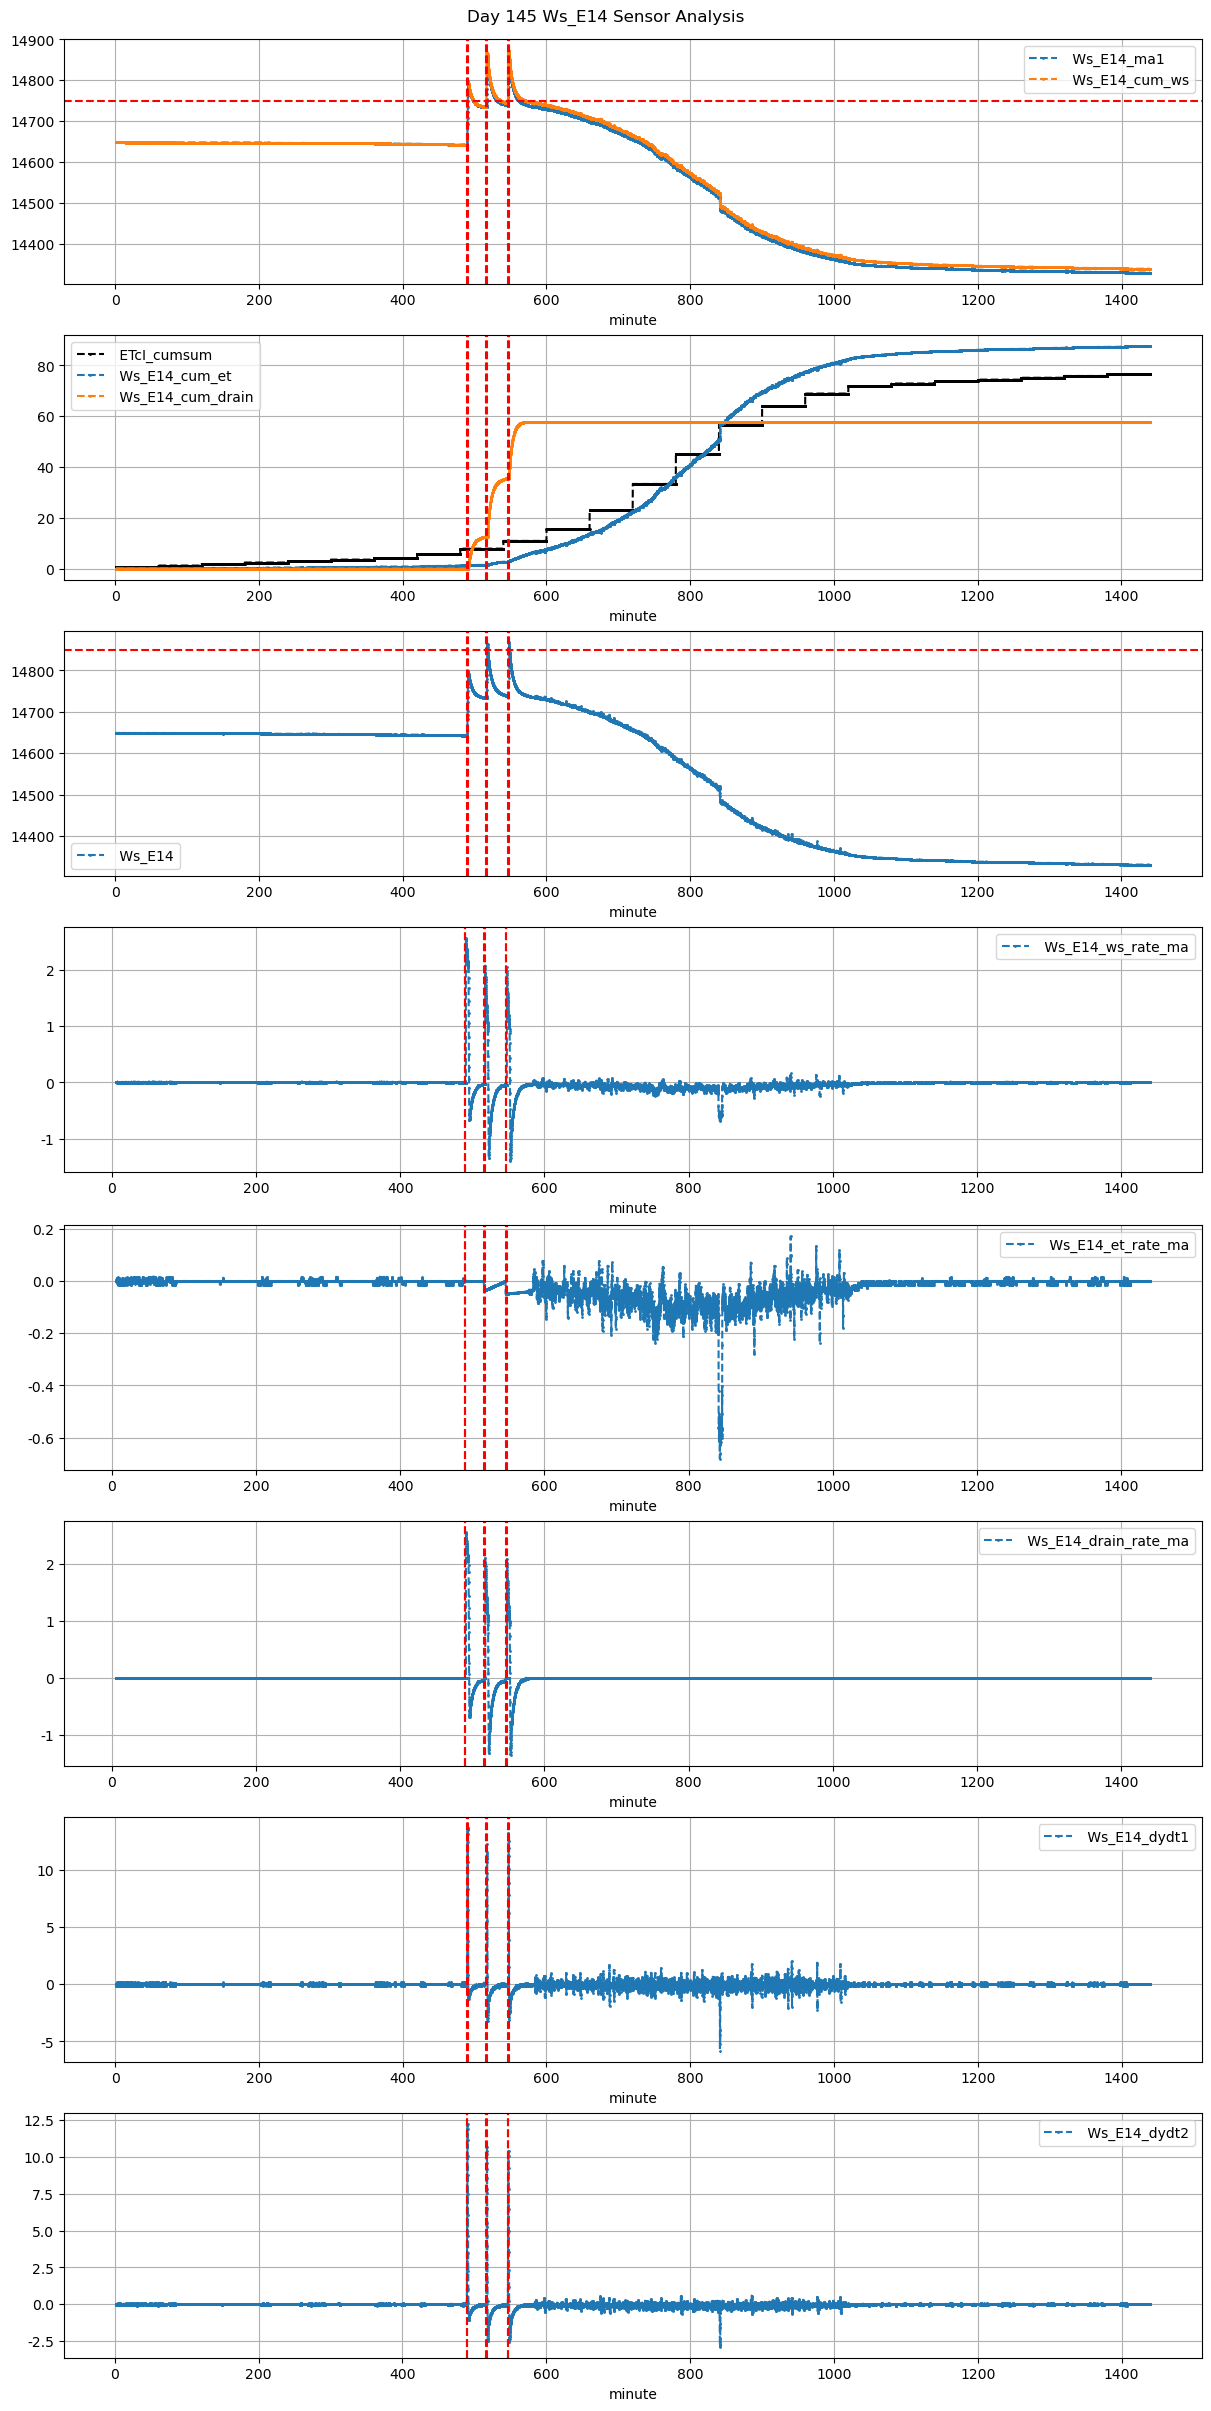
145 |
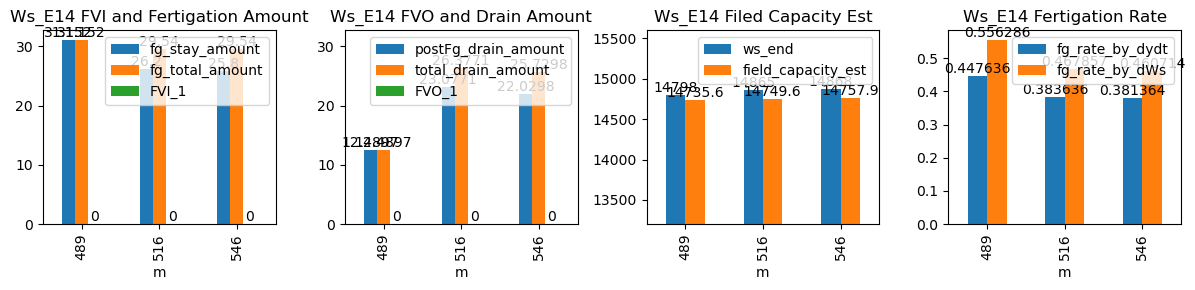
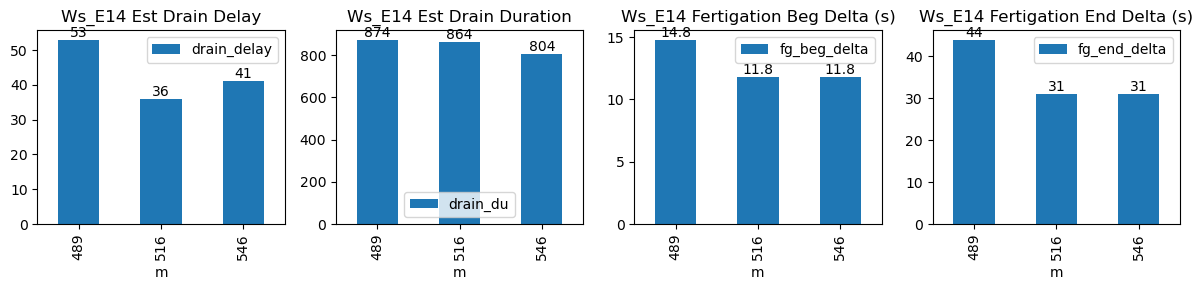
489 |
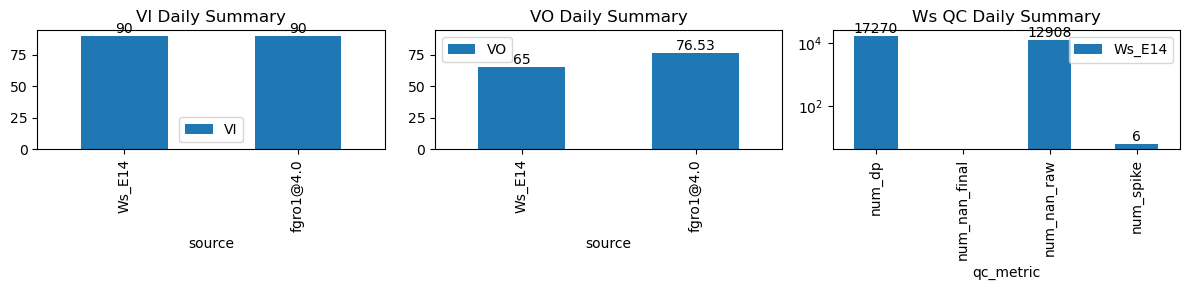
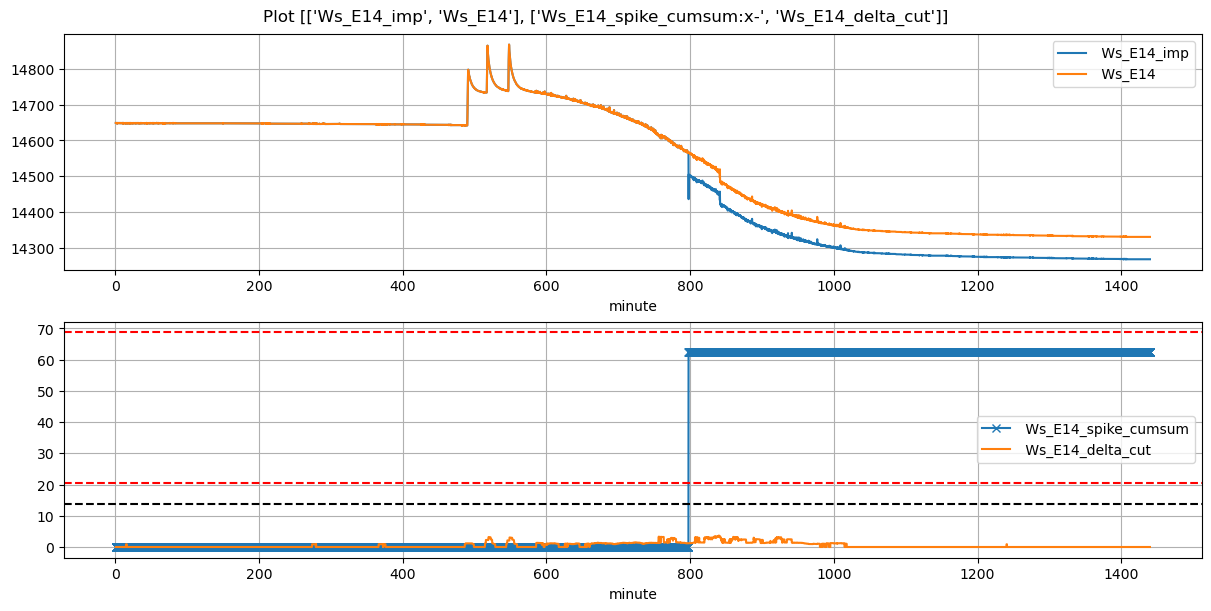
Ws_E14 |
0.797506 |
24.916667 |
489.42 |
489.666667 |
490.35 |
491.083333 |
14642.24 |
14798.0 |
56 |
-0.001806 |
-0.406898 |
0.000000 |
0.447636 |
0.556286 |
31.152 |
True |
14.8 |
44.0 |
31.152 |
0.0 |
12.489742 |
12.489742 |
874 |
53 |
-0.898269 |
14735.551289 |
NaN |
NaN |
| 2026-02-28 08:36:28+08:00 |
145 |
516 |
Ws_E14 |
0.797506 |
28.083333 |
516.47 |
516.666667 |
517.40 |
517.916667 |
14734.00 |
14865.0 |
56 |
-0.034722 |
-0.734896 |
0.000000 |
0.383636 |
0.467857 |
26.200 |
True |
11.8 |
31.0 |
29.540 |
3.3 |
23.077116 |
26.377116 |
864 |
36 |
-1.476756 |
14749.614422 |
NaN |
NaN |
| 2026-02-28 09:06:28+08:00 |
145 |
546 |
Ws_E14 |
0.797506 |
30.000000 |
546.47 |
546.666667 |
547.40 |
547.916667 |
14739.00 |
14868.0 |
56 |
-0.048472 |
-0.760278 |
-0.039757 |
0.381364 |
0.460714 |
25.800 |
True |
11.8 |
31.0 |
29.540 |
3.7 |
22.029797 |
25.729797 |
804 |
41 |
-1.626928 |
14757.851015 |
NaN |
NaN |