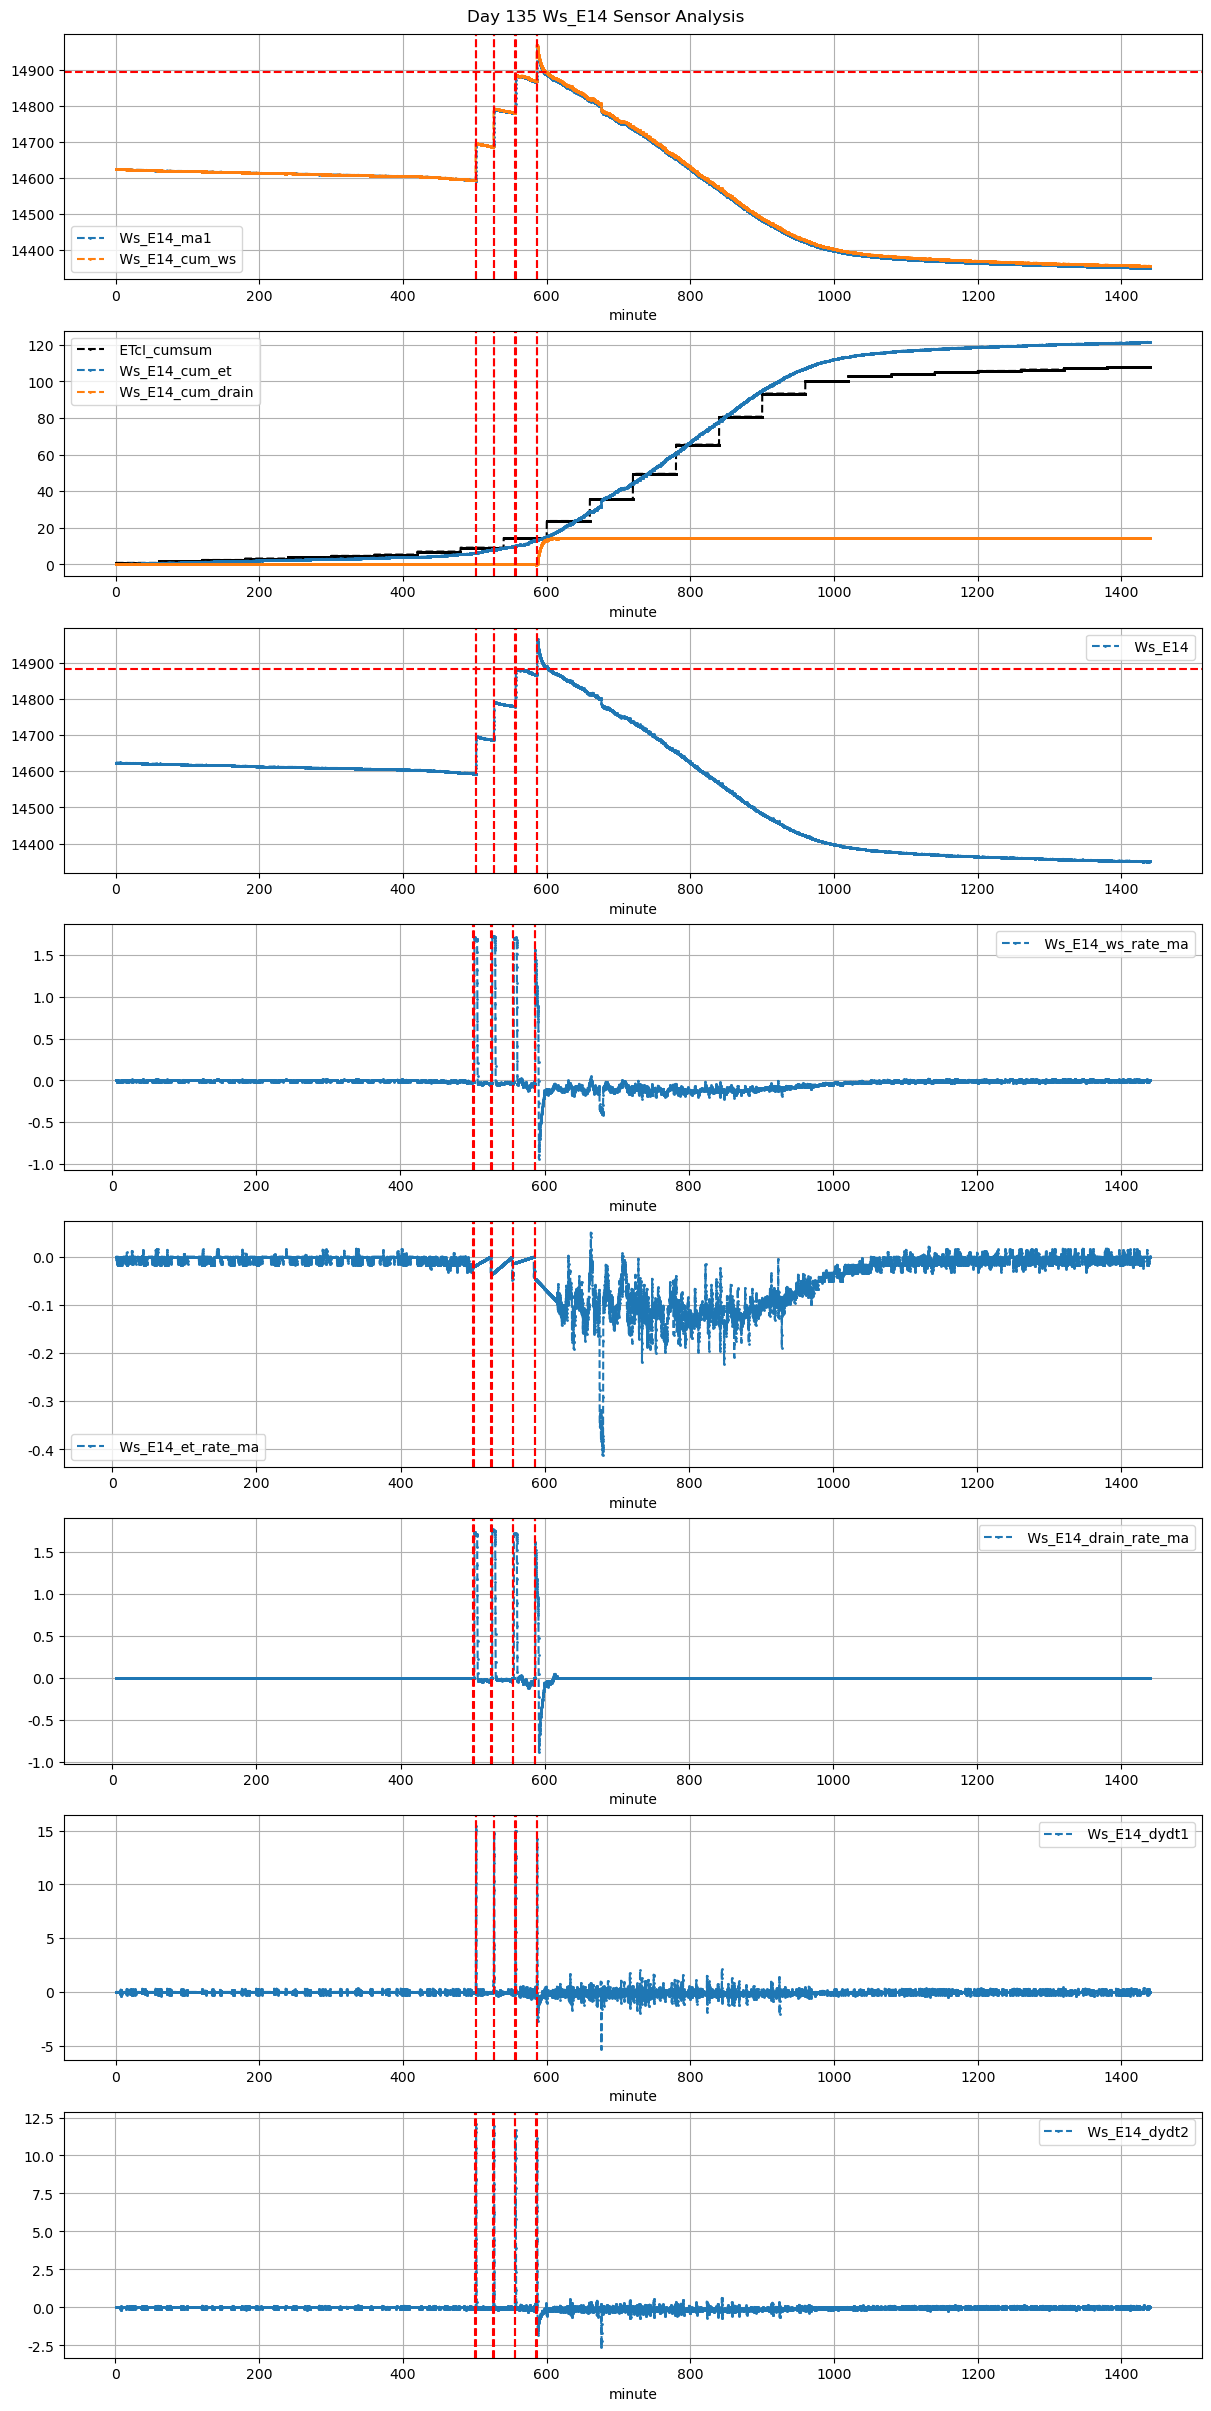
| 2026-02-18 08:20:59+08:00 |
135 |
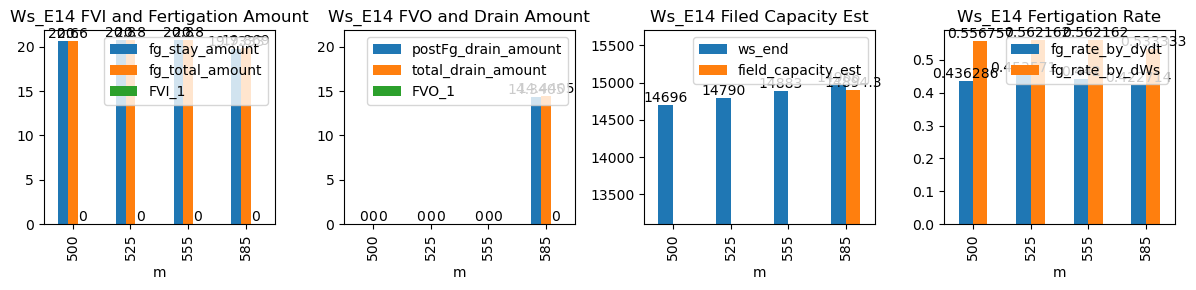
500 |
Ws_E14 |
0.539438 |
22.583333 |
500.98 |
501.333333 |
501.6 |
502.416667 |
14593.000000 |
14696.0 |
37 |
-0.019236 |
-0.035243 |
0.00000 |
0.436286 |
0.556757 |
20.600000 |
True |
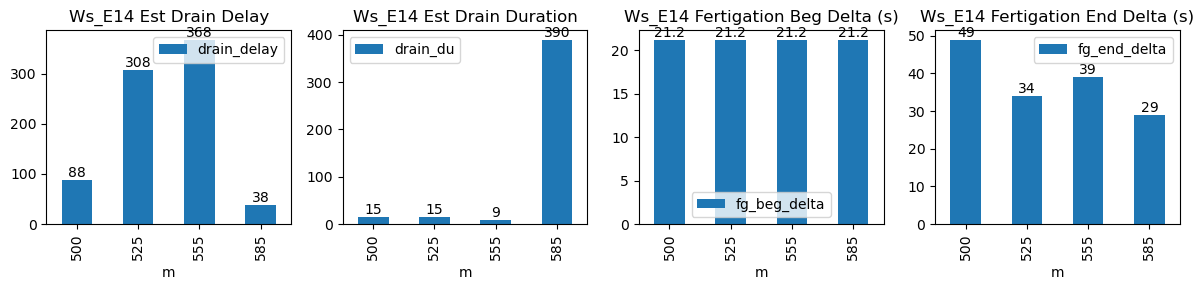
21.2 |
49.0 |
20.600 |
0.0 |
0.000000 |
0.000000 |
15 |
88 |
-0.207176 |
NaN |
NaN |
NaN |
| 2026-02-18 08:45:59+08:00 |
135 |
525 |
Ws_E14 |
0.539438 |
27.833333 |
525.98 |
526.333333 |
526.6 |
527.166667 |
14686.000000 |
14790.0 |
37 |
-0.035556 |
-0.041111 |
0.00000 |
0.453571 |
0.562162 |
20.800000 |
True |
21.2 |
34.0 |
20.800 |
0.0 |
0.000000 |
0.000000 |
15 |
308 |
-0.247715 |
NaN |
NaN |
NaN |
| 2026-02-18 09:15:59+08:00 |
135 |
555 |
Ws_E14 |
0.539438 |
27.750000 |
555.98 |
556.333333 |
556.6 |
557.250000 |
14779.000000 |
14883.0 |
37 |
-0.034190 |
-0.013514 |
0.00000 |
0.442000 |
0.562162 |
20.800000 |
True |
21.2 |
39.0 |
20.800 |
0.0 |
0.000000 |
0.000000 |
9 |
368 |
-0.437006 |
NaN |
NaN |
NaN |
| 2026-02-18 09:45:59+08:00 |
135 |
585 |
Ws_E14 |
0.539438 |
30.000000 |
585.98 |
586.333333 |
586.6 |
587.083333 |
14867.333333 |
14966.0 |
37 |
-0.046567 |
-0.534722 |
-0.09287 |
0.422714 |
0.533333 |
19.733333 |
True |
21.2 |
29.0 |
19.869 |
0.1 |
14.340497 |
14.440497 |
390 |
38 |
-1.209876 |
14894.297513 |
NaN |
NaN |