| 2026-02-17 08:21:01+08:00 |
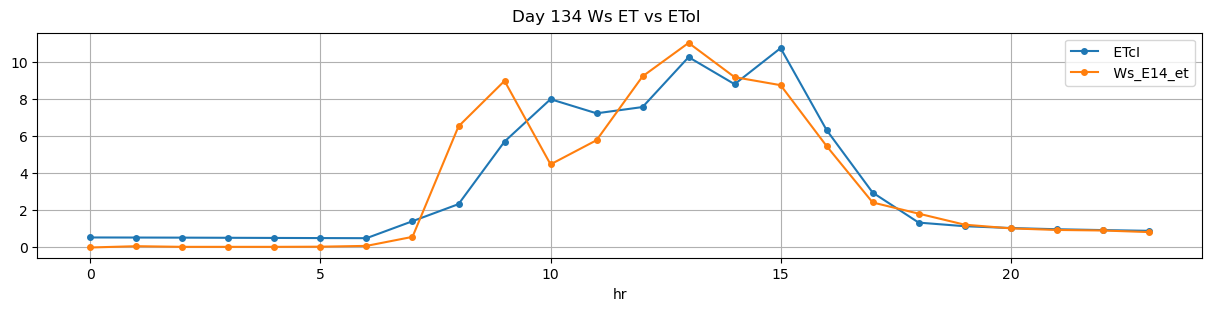
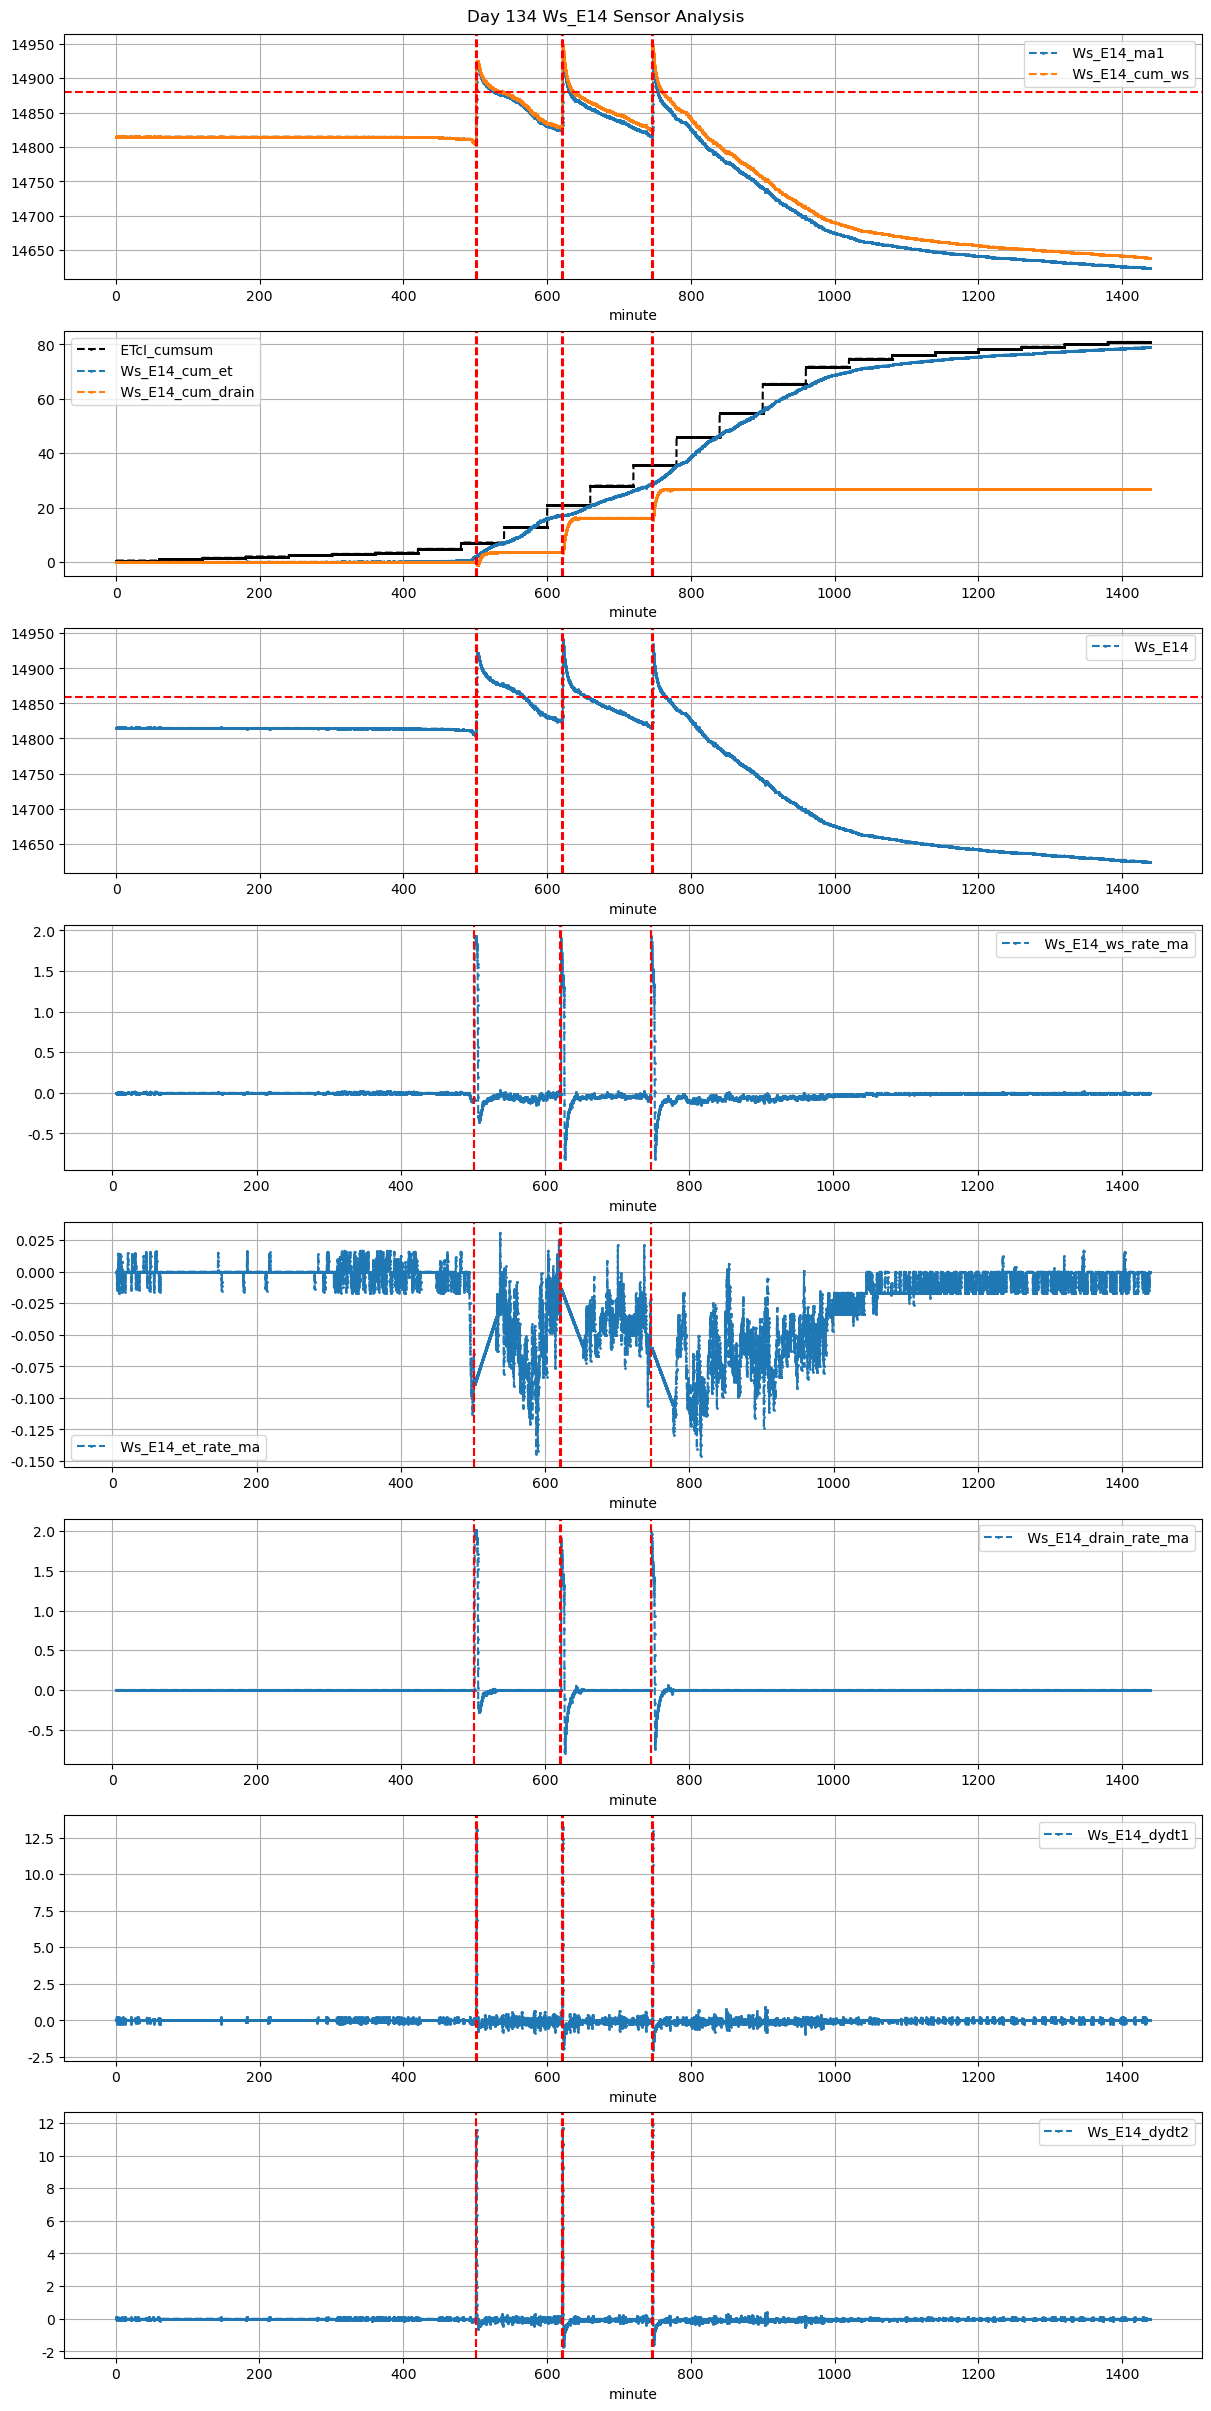
134 |
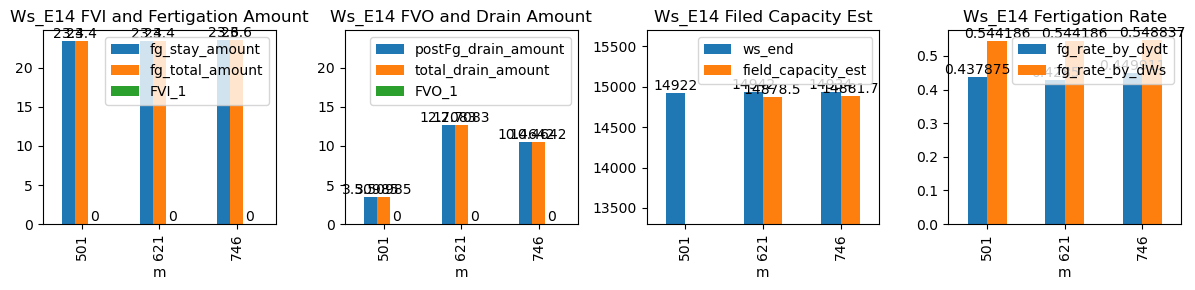
501 |
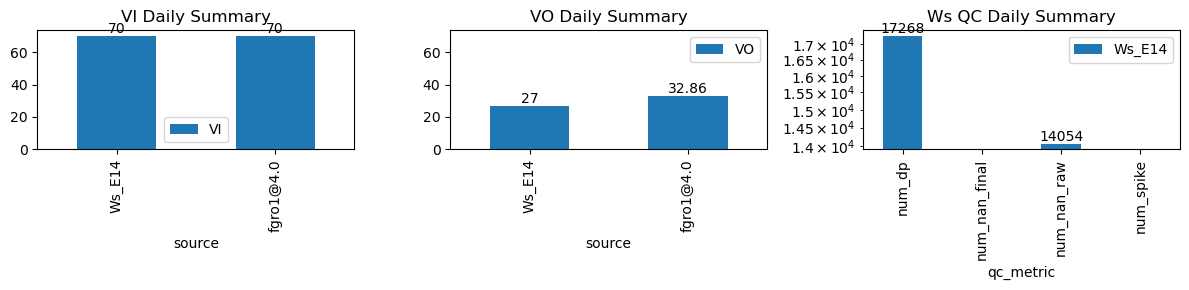
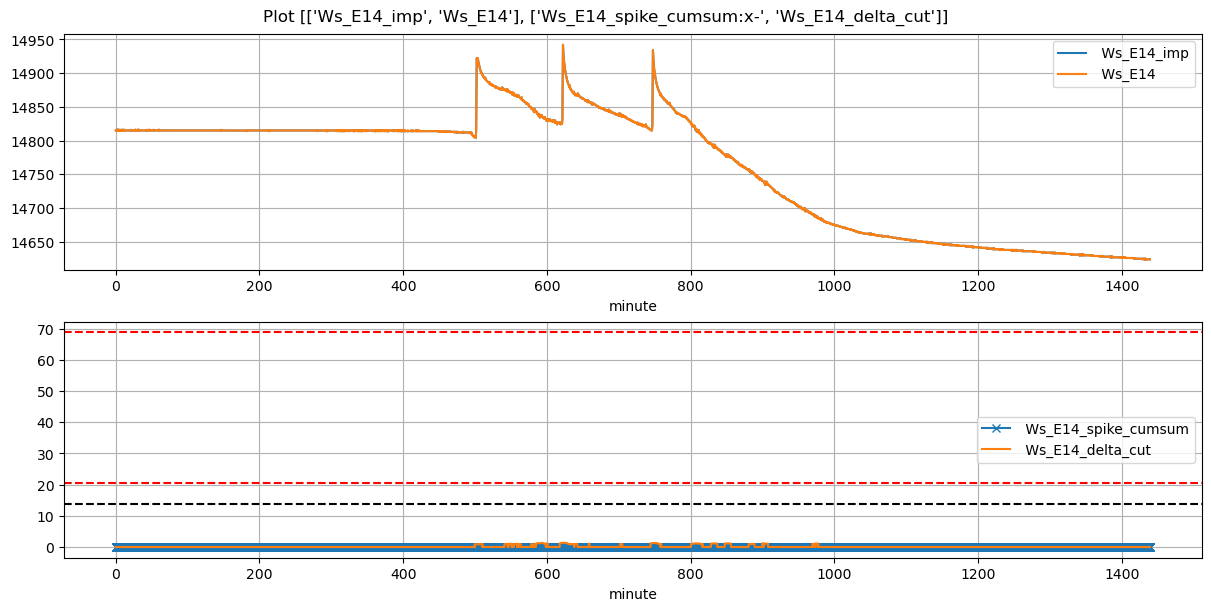
Ws_E14 |
0.45631 |
30 |
501.02 |
501.333333 |
501.74 |
502.250000 |
14805.0 |
14922.0 |
43 |
-0.088704 |
-0.283214 |
-0.036111 |
0.437875 |
0.544186 |
23.4 |
True |
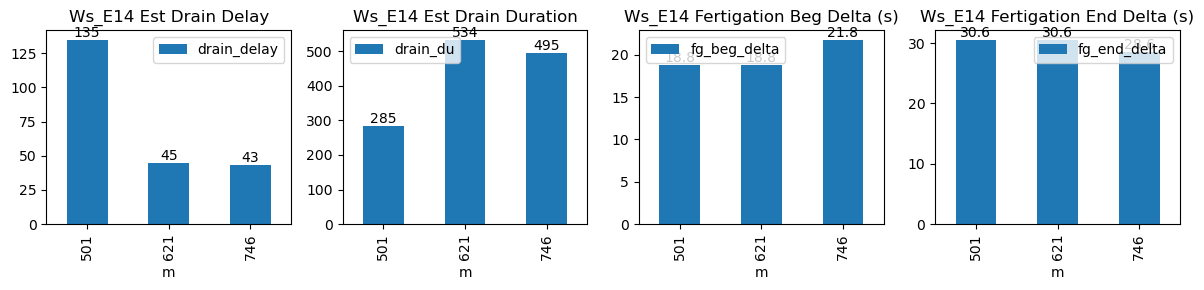
18.8 |
30.6 |
23.4 |
0.0 |
3.509847 |
3.509847 |
285 |
135 |
-0.415105 |
NaN |
NaN |
NaN |
| 2026-02-17 10:21:01+08:00 |
134 |
621 |
Ws_E14 |
0.45631 |
30 |
621.02 |
621.333333 |
621.74 |
622.250000 |
14825.0 |
14942.0 |
43 |
-0.014097 |
-0.456500 |
-0.059139 |
0.428500 |
0.544186 |
23.4 |
True |
18.8 |
30.6 |
23.4 |
0.0 |
12.708338 |
12.708338 |
534 |
45 |
-1.046653 |
14878.458309 |
NaN |
NaN |
| 2026-02-17 12:26:13+08:00 |
134 |
746 |
Ws_E14 |
0.45631 |
30 |
746.22 |
746.583333 |
746.94 |
747.416667 |
14816.0 |
14934.0 |
43 |
-0.060171 |
-0.454028 |
-0.105898 |
0.449911 |
0.548837 |
23.6 |
True |
21.8 |
28.6 |
23.6 |
0.0 |
10.464201 |
10.464201 |
495 |
43 |
-1.062409 |
14881.678993 |
NaN |
NaN |