| 2026-02-08 10:23:31+08:00 |
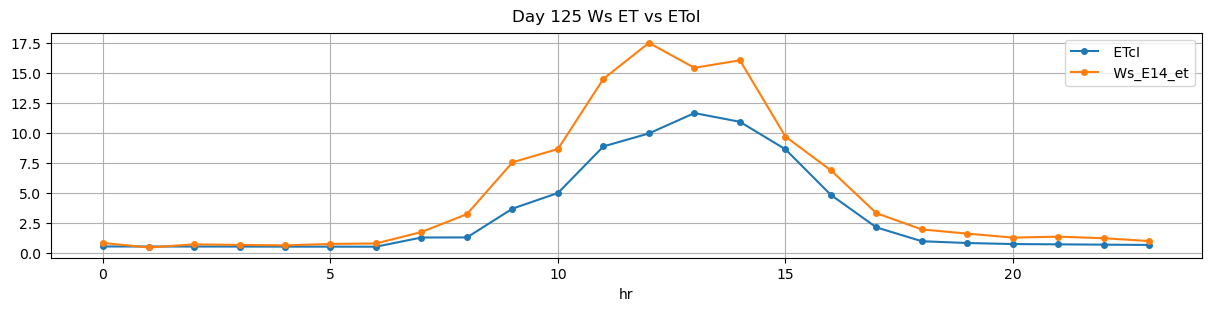
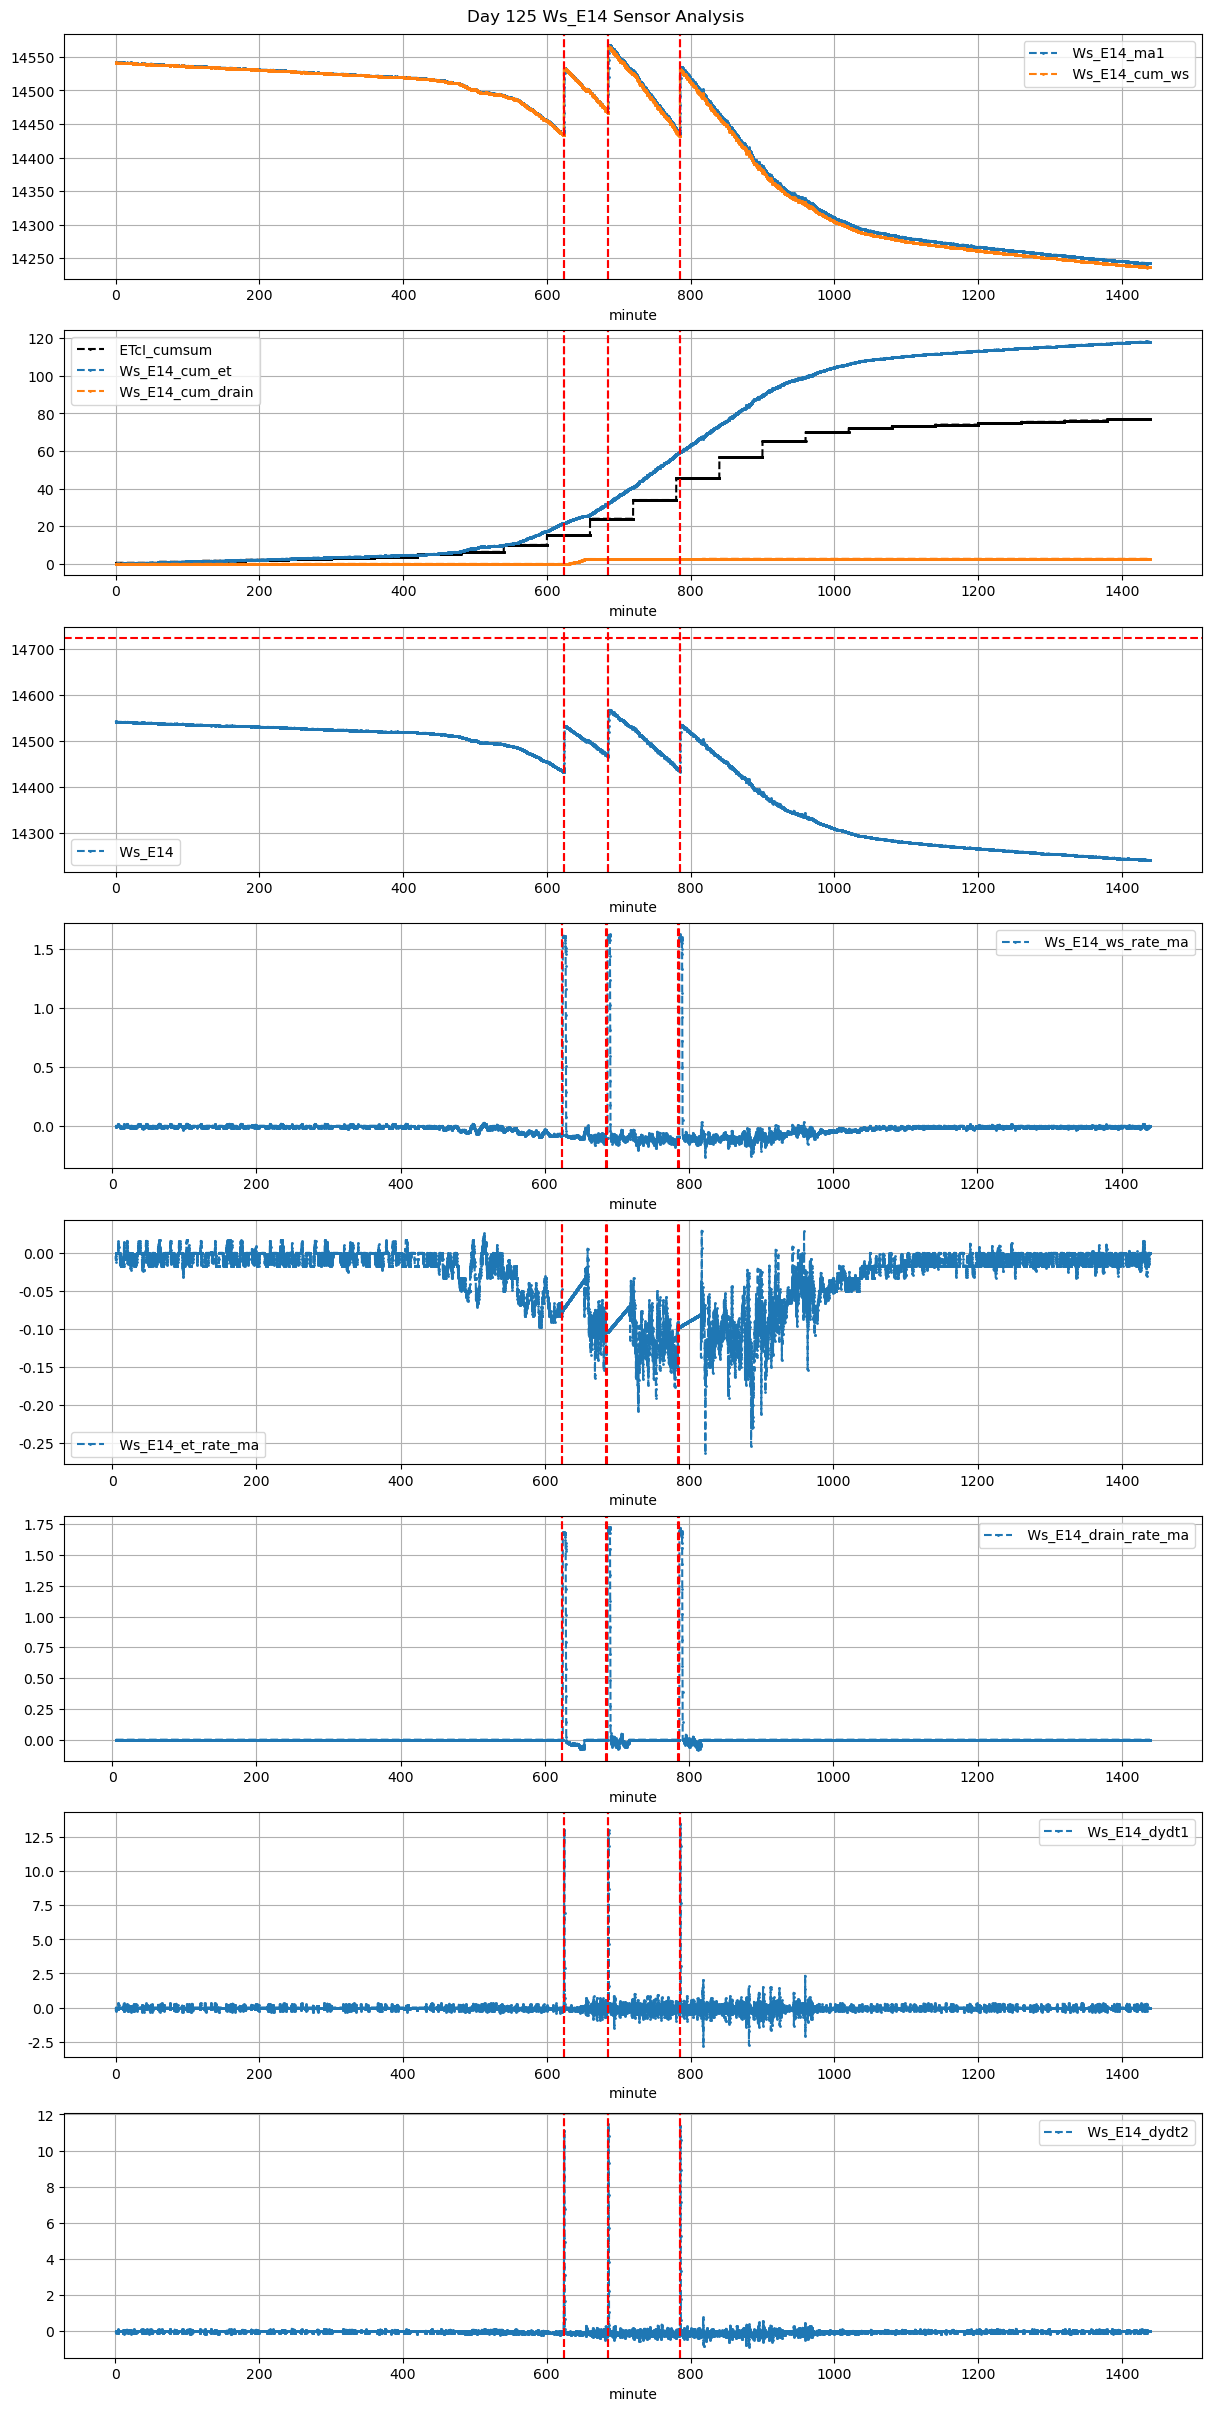
125 |
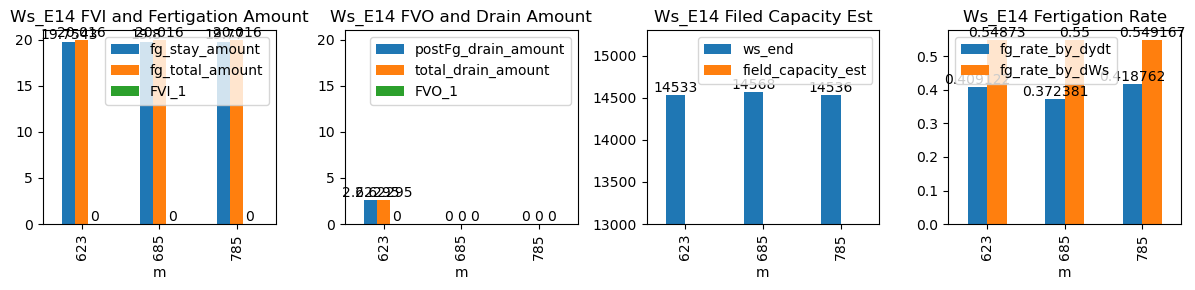
623 |
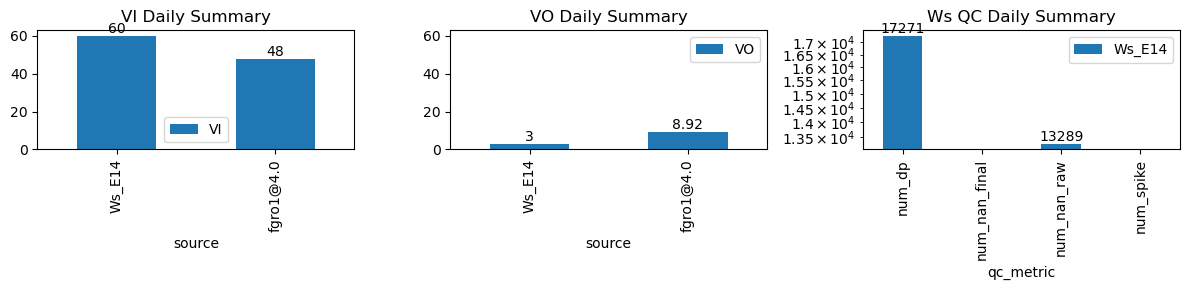
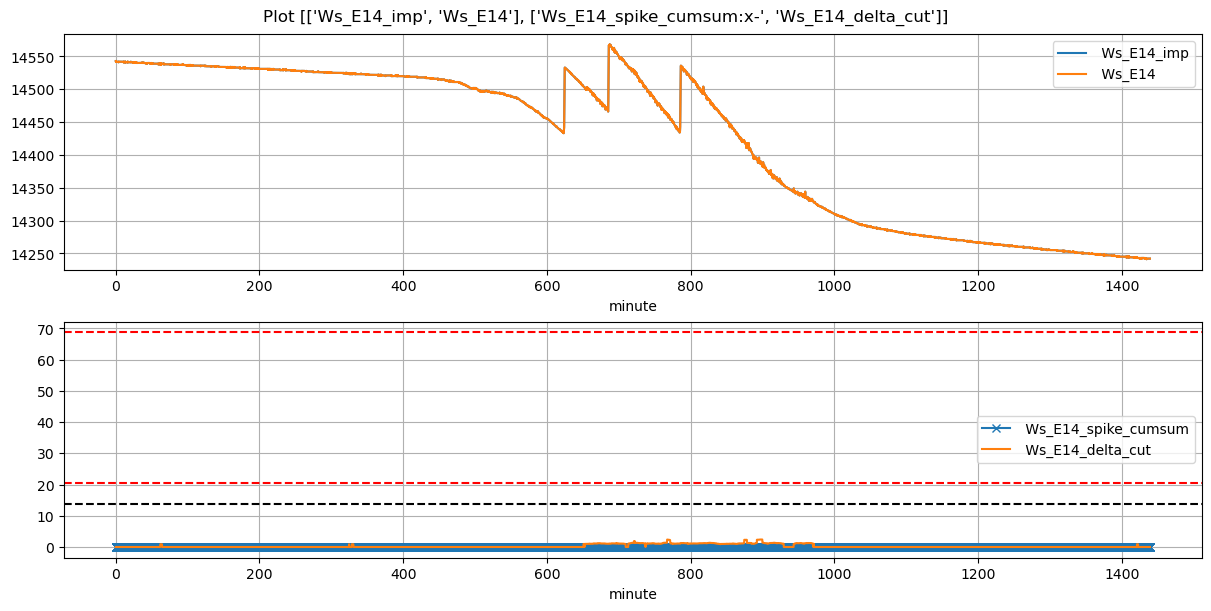
Ws_E14 |
0.380331 |
30 |
623.52 |
623.833333 |
624.12 |
624.833333 |
14434.228571 |
14533.0 |
36 |
-0.074677 |
-0.088646 |
-0.034845 |
0.409122 |
0.548730 |
19.754286 |
True |
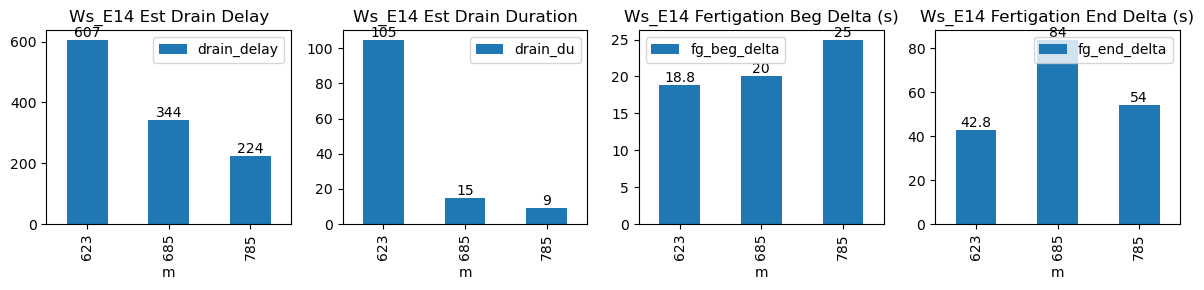
18.8 |
42.8 |
20.016 |
0.0 |
2.622948 |
2.622948 |
105 |
607 |
-0.223840 |
NaN |
NaN |
NaN |
| 2026-02-08 11:25:00+08:00 |
125 |
685 |
Ws_E14 |
0.380331 |
30 |
685.00 |
685.333333 |
685.60 |
687.000000 |
14469.000000 |
14568.0 |
36 |
-0.105791 |
-0.104259 |
-0.070463 |
0.372381 |
0.550000 |
19.800000 |
True |
20.0 |
84.0 |
20.016 |
0.0 |
0.000000 |
0.000000 |
15 |
344 |
-0.483163 |
NaN |
NaN |
NaN |
| 2026-02-08 13:05:00+08:00 |
125 |
785 |
Ws_E14 |
0.380331 |
30 |
785.00 |
785.416667 |
785.60 |
786.500000 |
14437.150000 |
14536.0 |
36 |
-0.125706 |
-0.097454 |
-0.080775 |
0.418762 |
0.549167 |
19.770000 |
True |
25.0 |
54.0 |
20.016 |
0.0 |
0.000000 |
0.000000 |
9 |
224 |
-0.505664 |
NaN |
NaN |
NaN |