| 2026-02-09 08:28:31+08:00 |
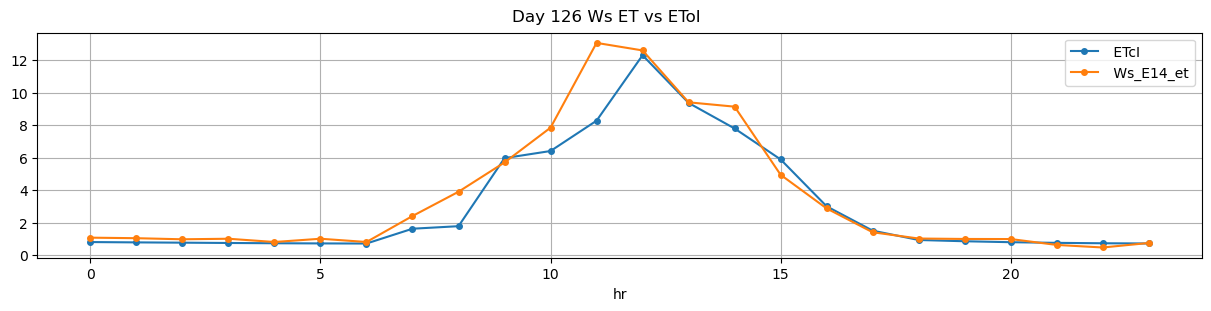
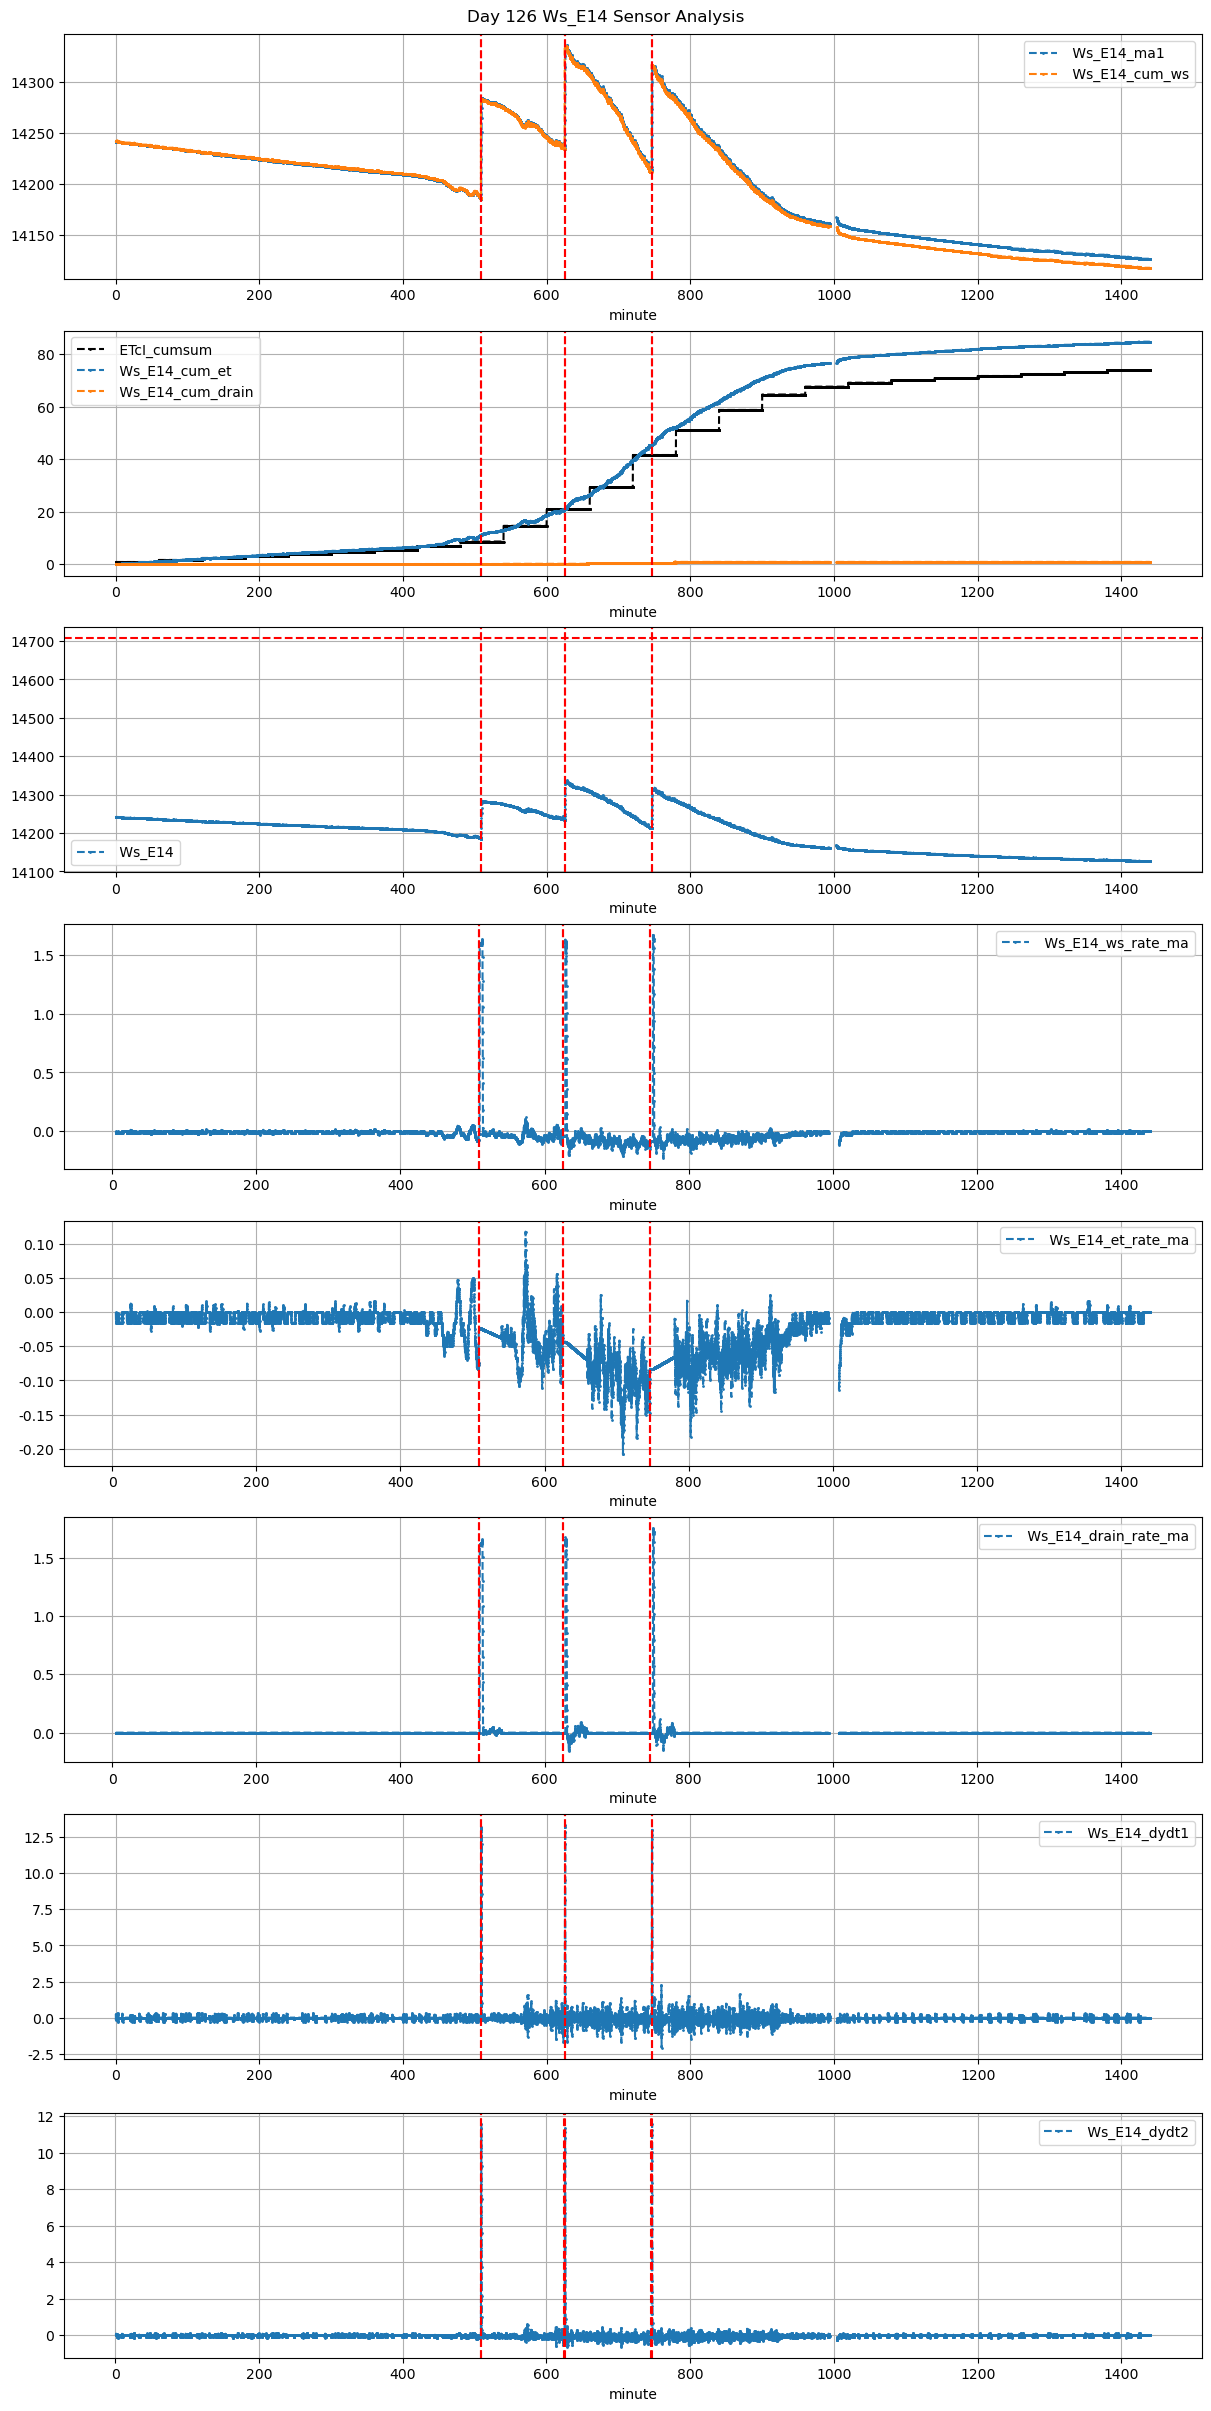
126 |
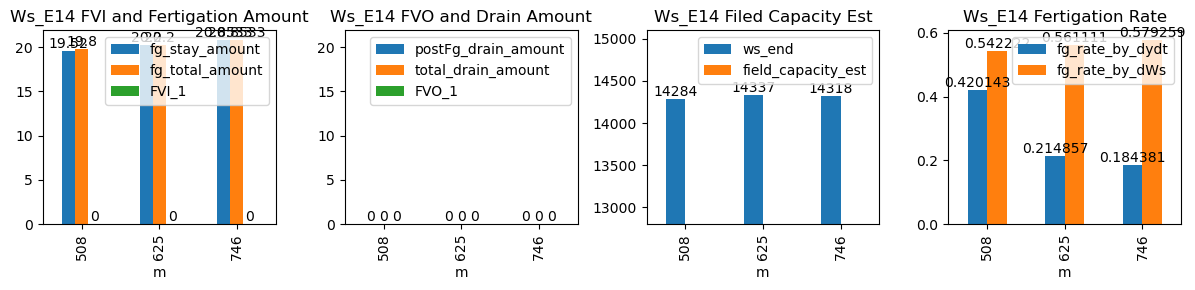
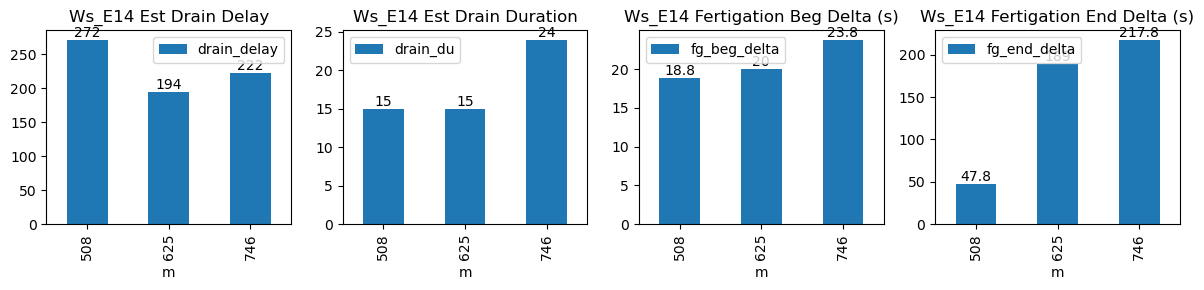
508 |
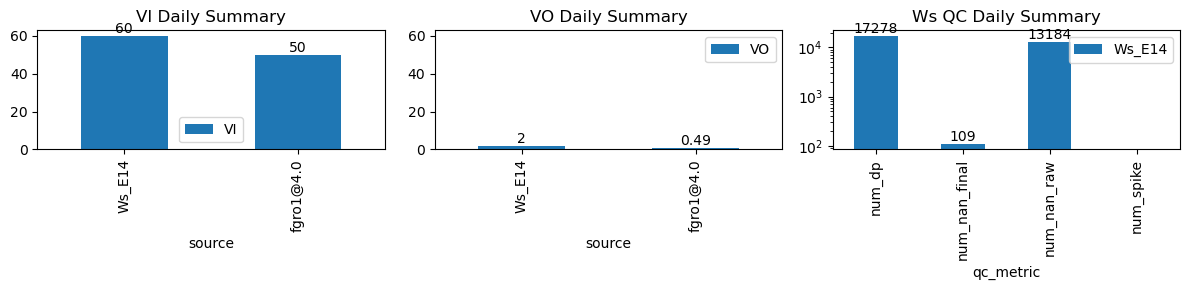
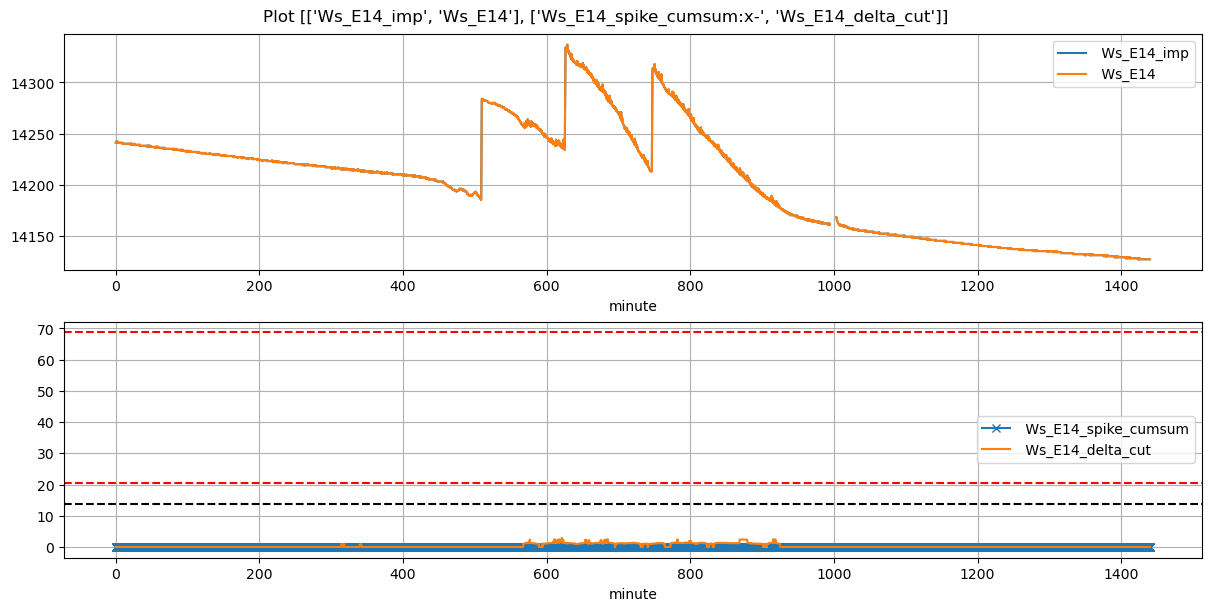
Ws_E14 |
0.349239 |
30 |
508.52 |
508.833333 |
509.12 |
509.916667 |
14186.400000 |
14284.0 |
36 |
-0.067662 |
-0.023327 |
-0.037444 |
0.420143 |
0.542222 |
19.520000 |
True |
18.8 |
47.8 |
19.800000 |
0.0 |
0 |
0.0 |
15 |
272 |
-0.133340 |
NaN |
NaN |
NaN |
| 2026-02-09 10:25:00+08:00 |
126 |
625 |
Ws_E14 |
0.349239 |
30 |
625.00 |
625.333333 |
625.60 |
628.750000 |
14236.000000 |
14337.0 |
36 |
-0.043161 |
-0.108449 |
-0.069674 |
0.214857 |
0.561111 |
20.200000 |
True |
20.0 |
189.0 |
20.200000 |
0.0 |
0 |
0.0 |
15 |
194 |
-0.755919 |
NaN |
NaN |
NaN |
| 2026-02-09 12:26:01+08:00 |
126 |
746 |
Ws_E14 |
0.349239 |
30 |
746.02 |
746.416667 |
746.62 |
750.250000 |
14213.733333 |
14318.0 |
36 |
-0.107500 |
-0.083056 |
-0.065208 |
0.184381 |
0.579259 |
20.853333 |
True |
23.8 |
217.8 |
20.853333 |
0.0 |
0 |
0.0 |
24 |
222 |
-0.885590 |
NaN |
NaN |
NaN |