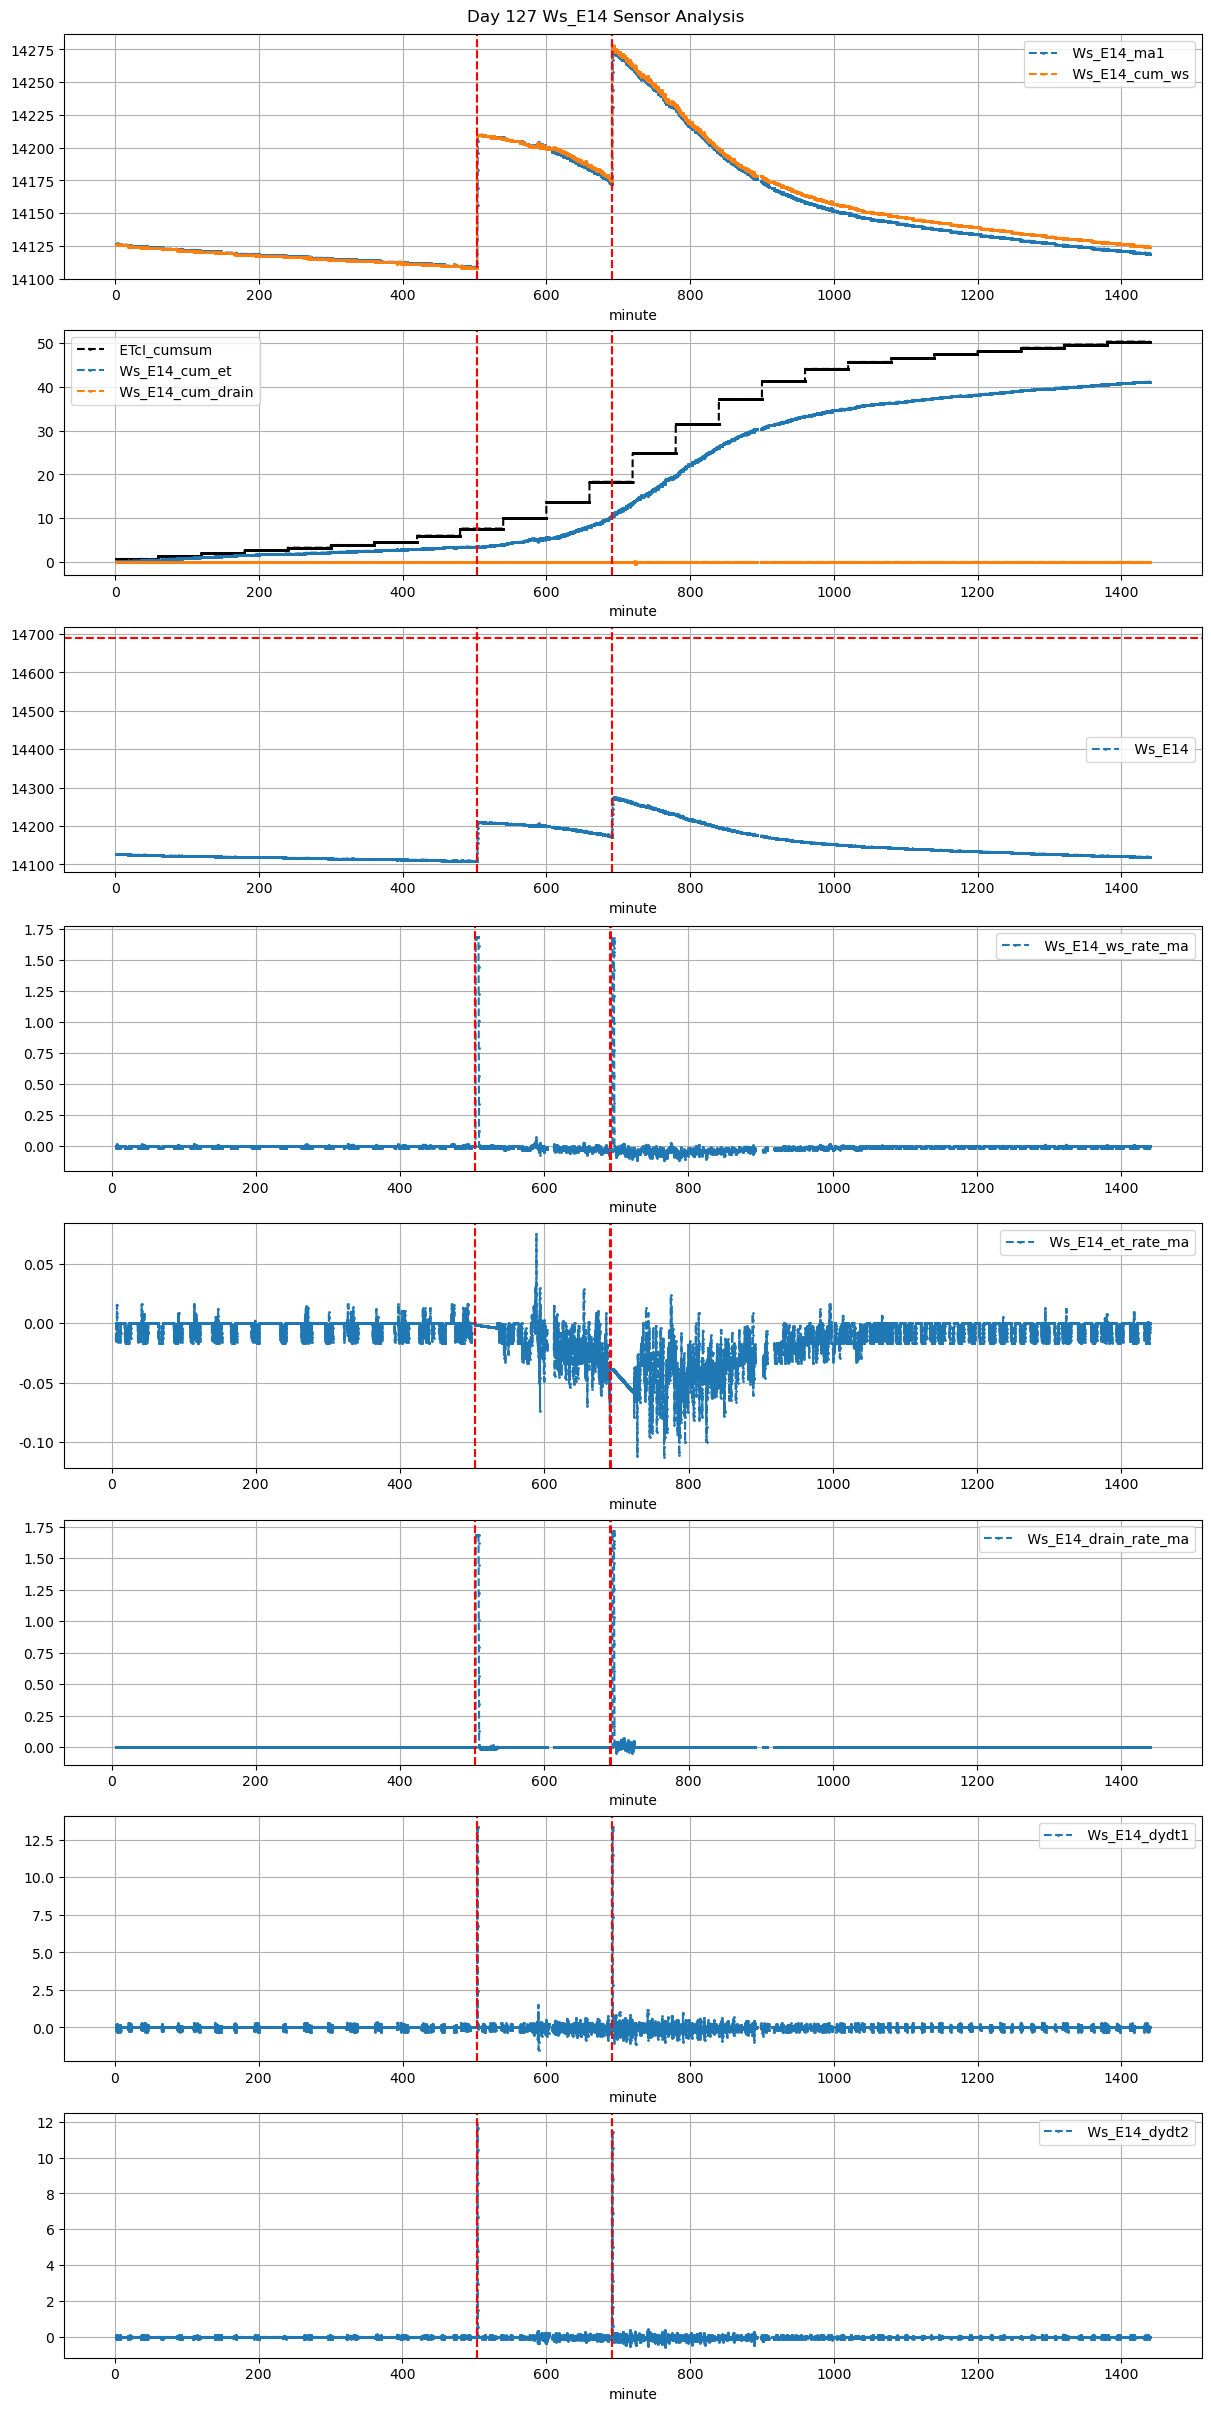
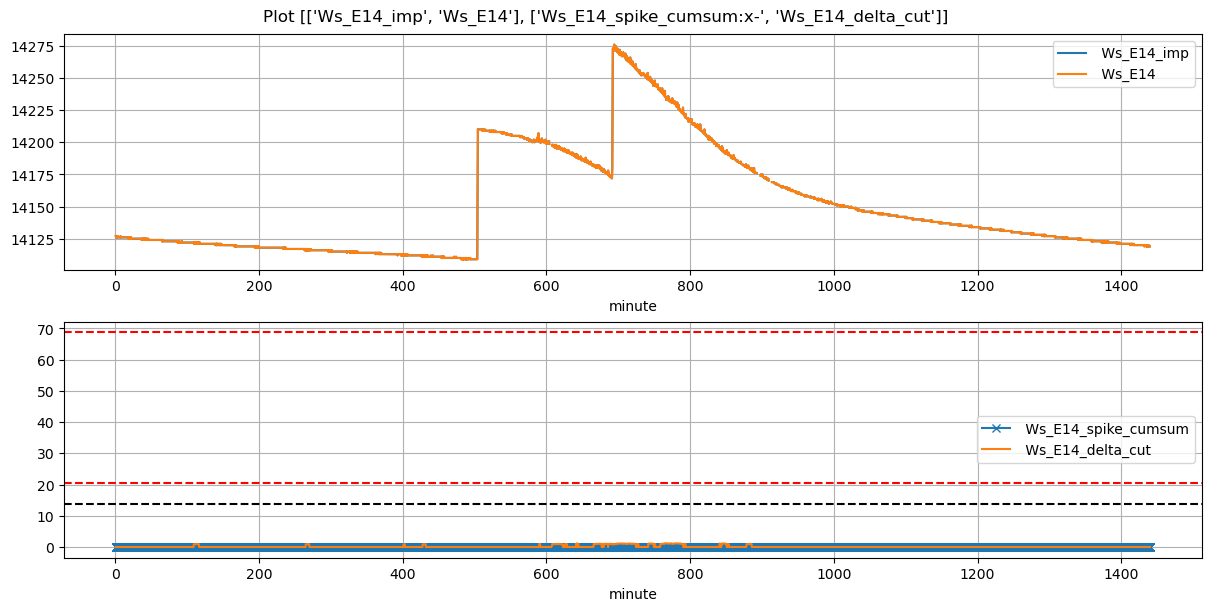
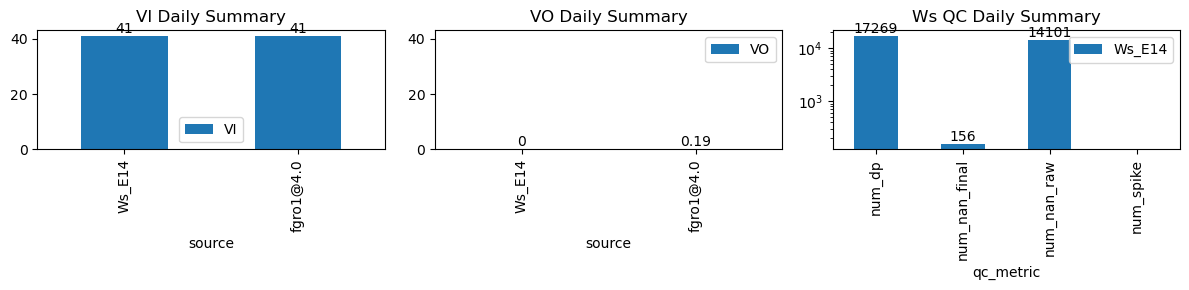
VI and VO Daily Summary
| ws_name | num_dp | num_nan_raw | num_nan_final | num_spike | cum_step_adj |
|---|---|---|---|---|---|
| Ws_E14 | 17,269 | 14,101 | 156 | 0 | 0.00 |
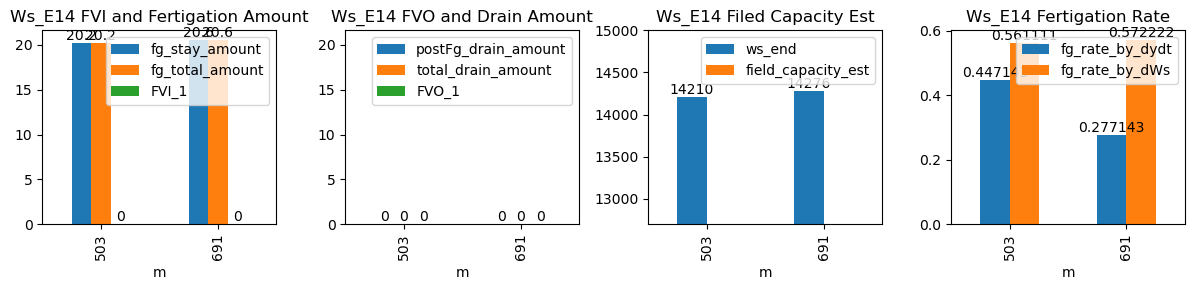
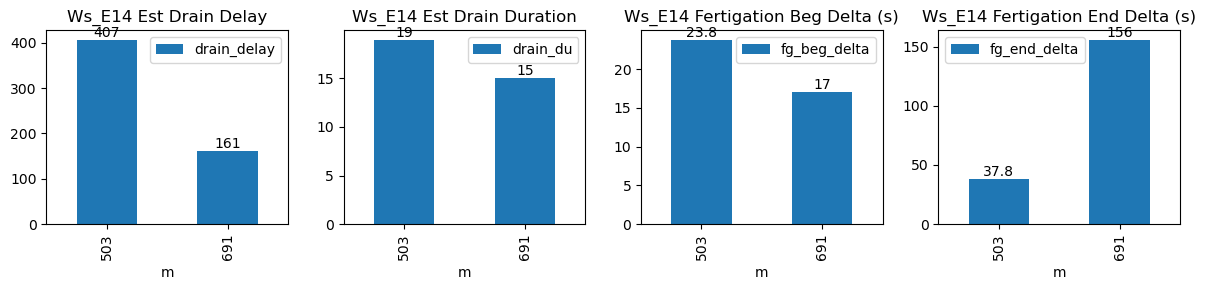
| ds | d | m | ws_name | prominence_cut | max_drain_du | fg_beg | fg_beg_est | fg_end | fg_end_est | ws_beg | ws_end | duc | pre_fg_et | post_fg_ws | post_drn_et | fg_rate_by_dydt | fg_rate_by_dWs | fg_stay_amount | enough_data | fg_beg_delta | fg_end_delta | fg_total_amount | fg_drain_amount | postFg_drain_amount | total_drain_amount | drain_du | drain_delay | drain_rate | field_capacity_est | FVI_1 | FVO_1 |
|---|---|---|---|---|---|---|---|---|---|---|---|---|---|---|---|---|---|---|---|---|---|---|---|---|---|---|---|---|---|---|---|
| 2026-02-10 08:23:31+08:00 | 127 | 503 | Ws_E14 | 0.249846 | 30 | 503.52 | 503.916667 | 504.12 | 504.75 | 14109.0 | 14210.0 | 36 | -0.001427 | -0.007653 | -0.003819 | 0.447143 | 0.561111 | 20.2 | True | 23.8 | 37.8 | 20.2 | 0.0 | 0 | 0.0 | 19 | 407 | -0.248005 | NaN | NaN | NaN |
| 2026-02-10 11:31:18+08:00 | 127 | 691 | Ws_E14 | 0.249846 | 30 | 691.30 | 691.583333 | 691.90 | 694.50 | 14173.0 | 14276.0 | 36 | -0.043889 | -0.038495 | -0.058869 | 0.277143 | 0.572222 | 20.6 | True | 17.0 | 156.0 | 20.6 | 0.0 | 0 | 0.0 | 15 | 161 | -0.704862 | NaN | NaN | NaN |