| 2026-03-13 08:20:00+08:00 |
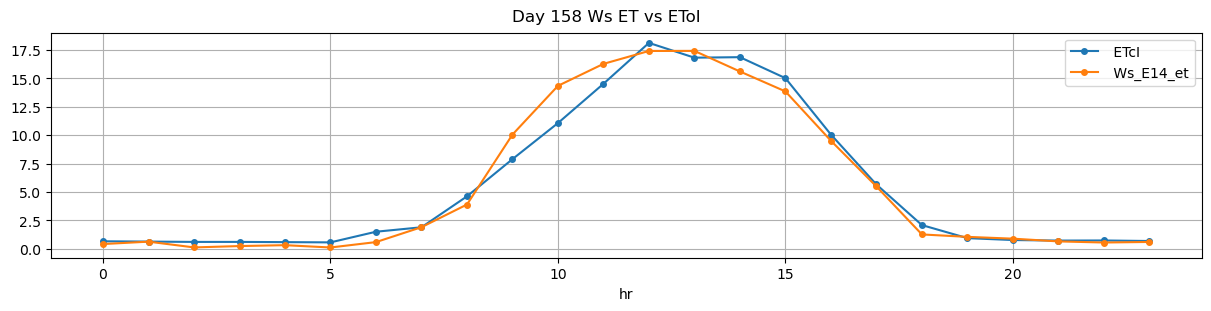
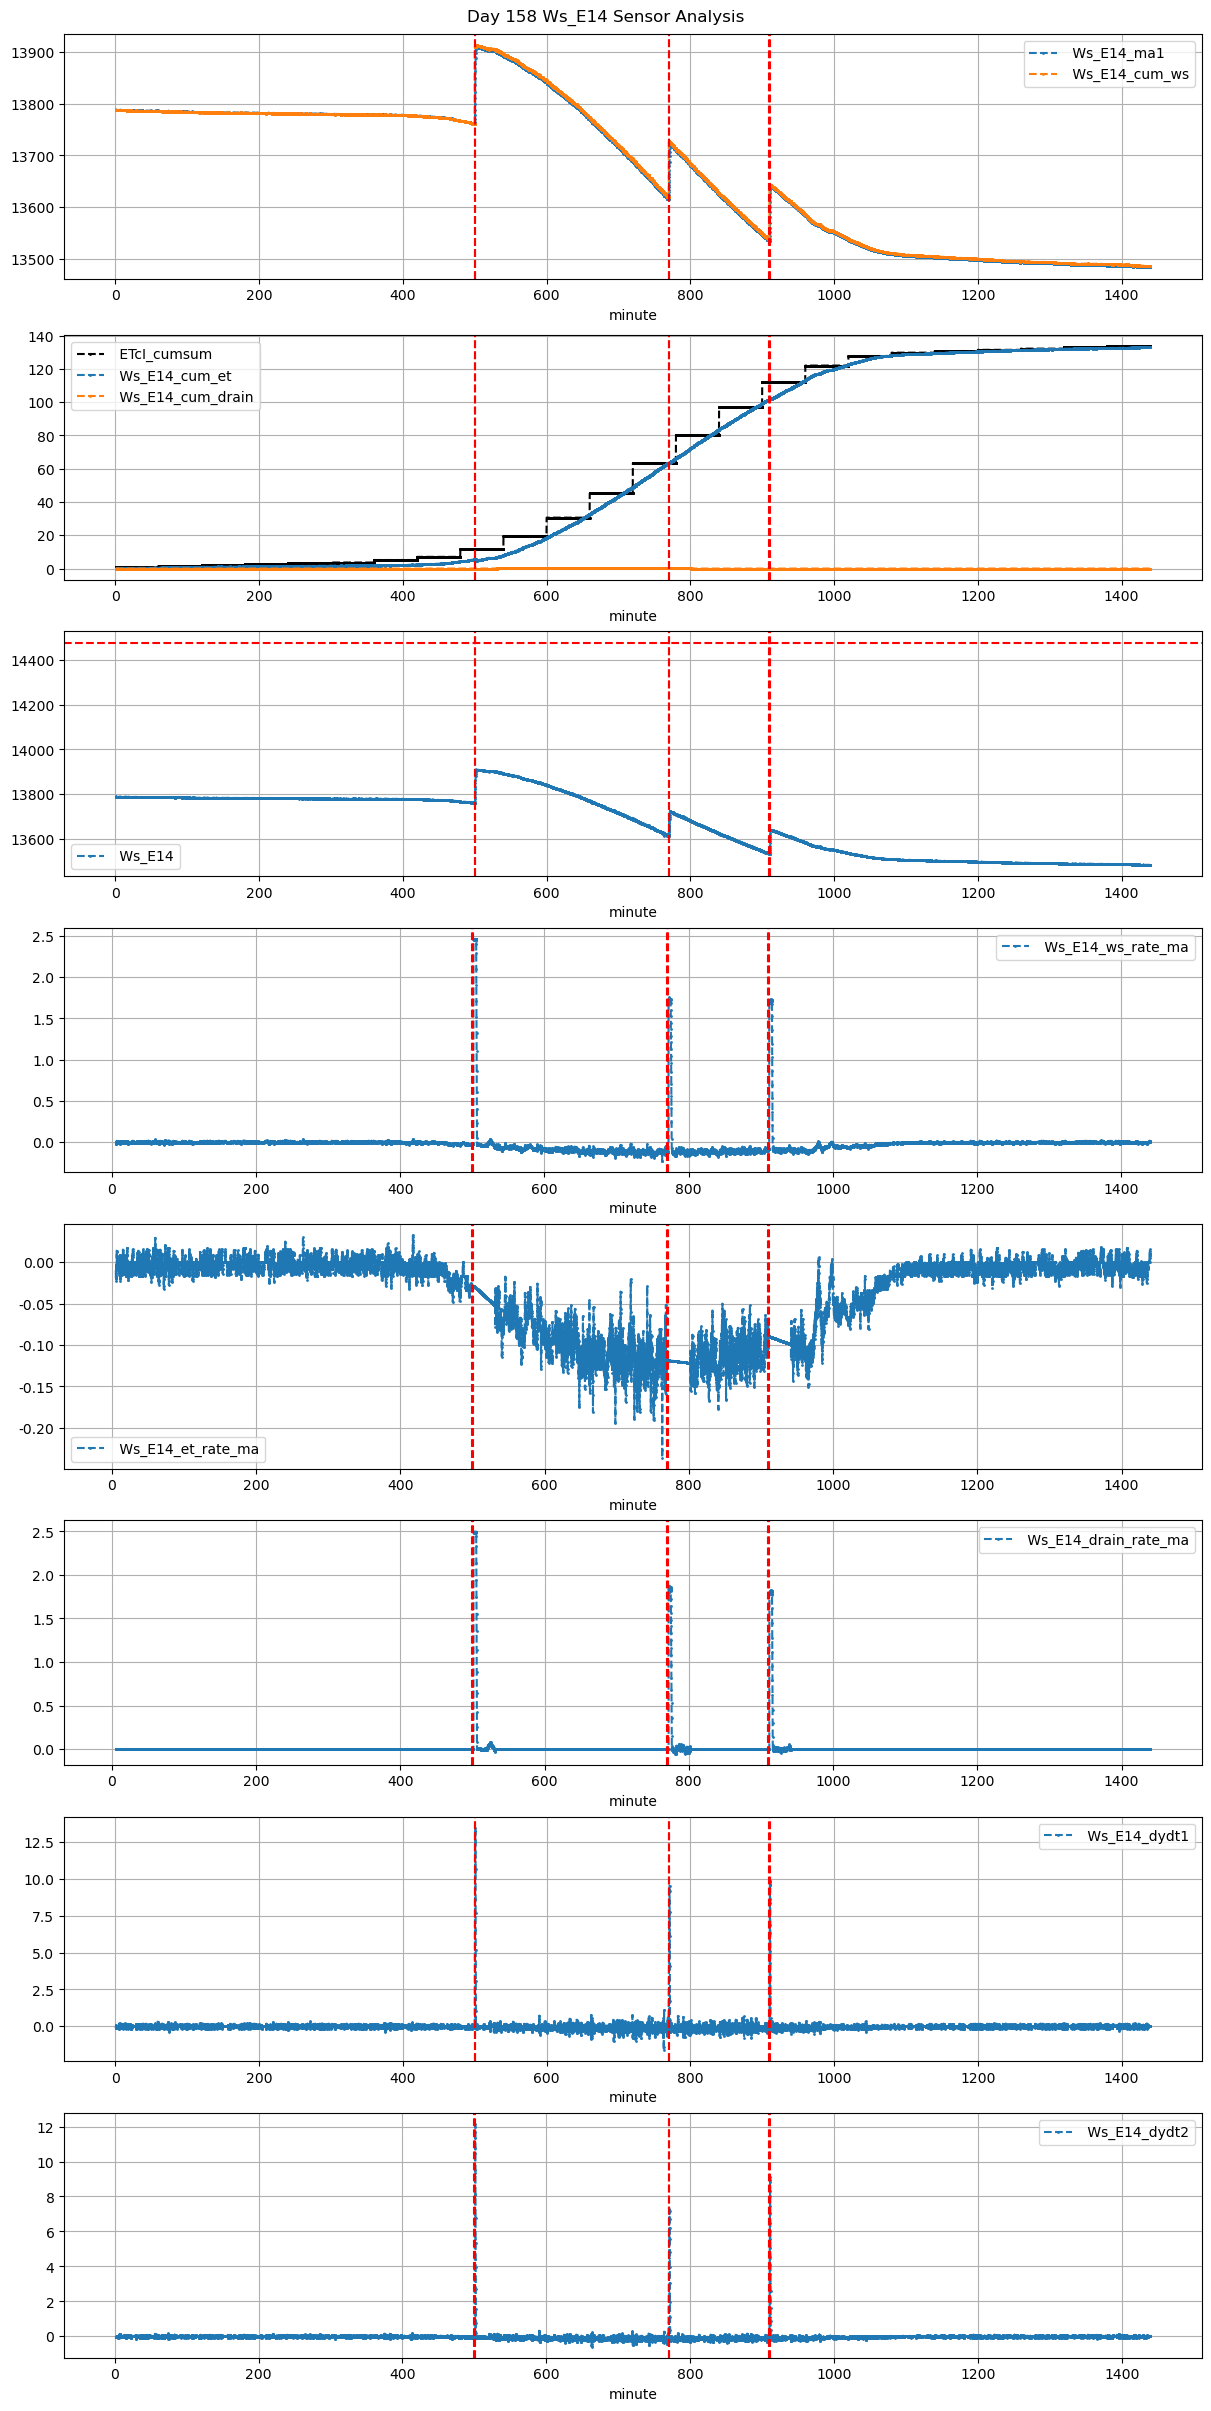
158 |
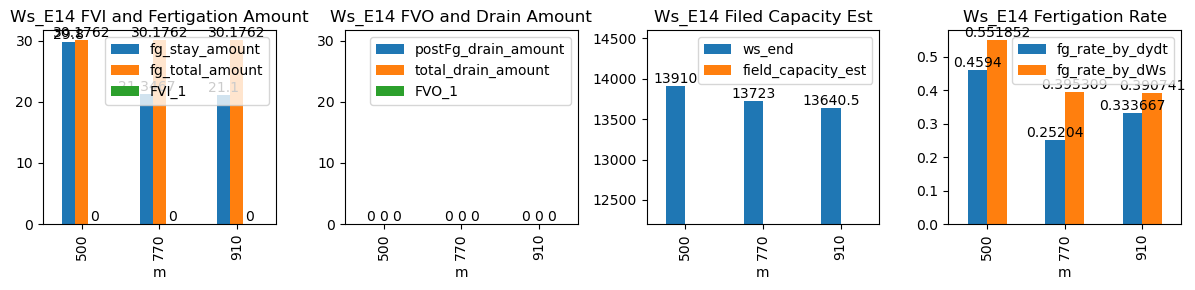
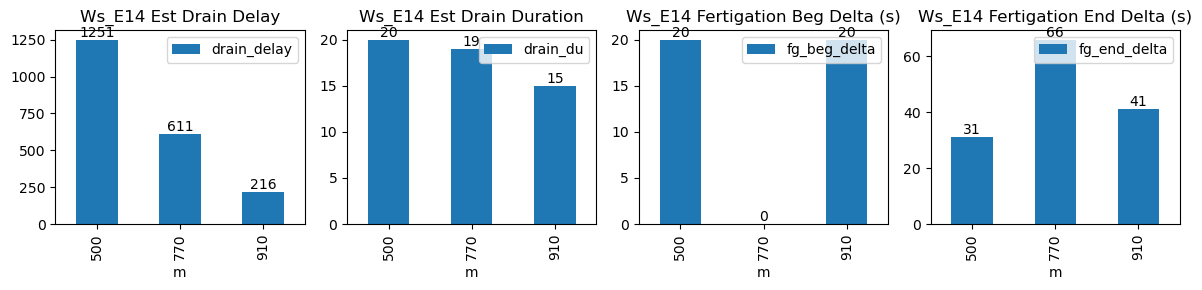
500 |
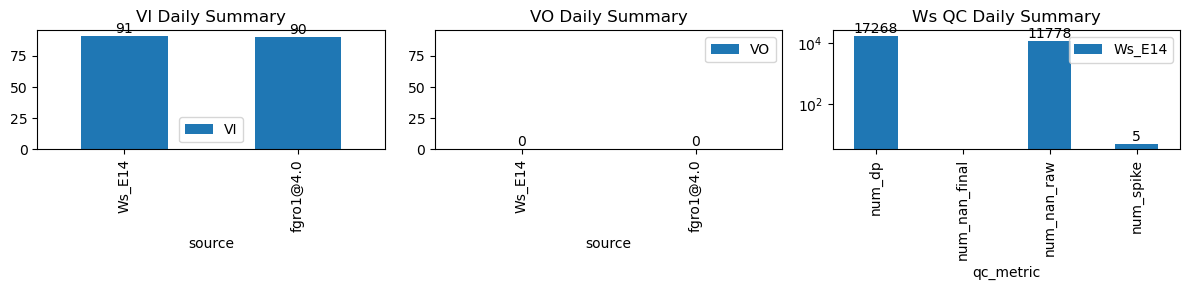
Ws_E14 |
0.335295 |
30 |
500.0 |
500.333333 |
500.9 |
501.416667 |
13761.000000 |
13910.0 |
54 |
-0.032667 |
-0.028287 |
-0.052202 |
0.459400 |
0.551852 |
29.800000 |
True |
20.0 |
31.0 |
30.176182 |
0.0 |
0 |
0.0 |
20 |
1251 |
-0.254860 |
NaN |
NaN |
NaN |
| 2026-03-13 12:50:00+08:00 |
158 |
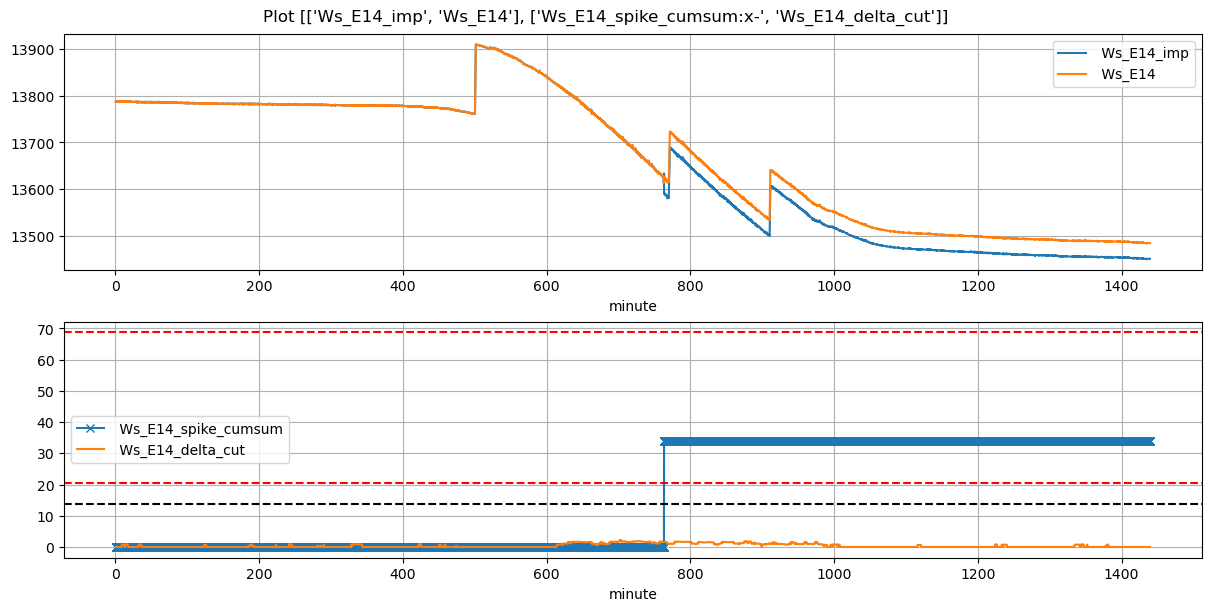
770 |
Ws_E14 |
0.335295 |
30 |
770.0 |
770.000000 |
770.9 |
772.000000 |
13616.266667 |
13723.0 |
54 |
-0.118585 |
-0.136213 |
-0.121662 |
0.252040 |
0.395309 |
21.346667 |
True |
0.0 |
66.0 |
30.176182 |
0.0 |
0 |
0.0 |
19 |
611 |
-0.395324 |
NaN |
NaN |
NaN |
| 2026-03-13 15:10:00+08:00 |
158 |
910 |
Ws_E14 |
0.335295 |
30 |
910.0 |
910.333333 |
910.9 |
911.583333 |
13535.000000 |
13640.5 |
54 |
-0.089713 |
-0.092685 |
-0.099171 |
0.333667 |
0.390741 |
21.100000 |
True |
20.0 |
41.0 |
30.176182 |
0.0 |
0 |
0.0 |
15 |
216 |
-0.227922 |
NaN |
NaN |
NaN |