VI and VO Daily Summary
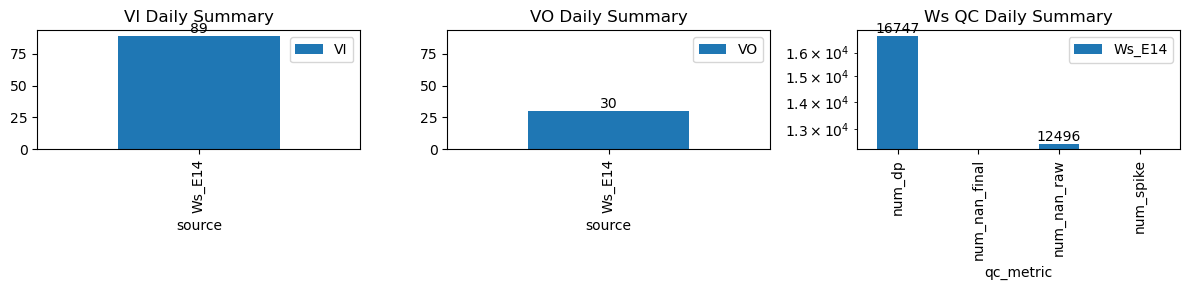
| ws_name | num_dp | num_nan_raw | num_nan_final | num_spike | cum_step_adj |
|---|---|---|---|---|---|
| Ws_E14 | 16,747 | 12,496 | 0 | 0 | 0.00 |
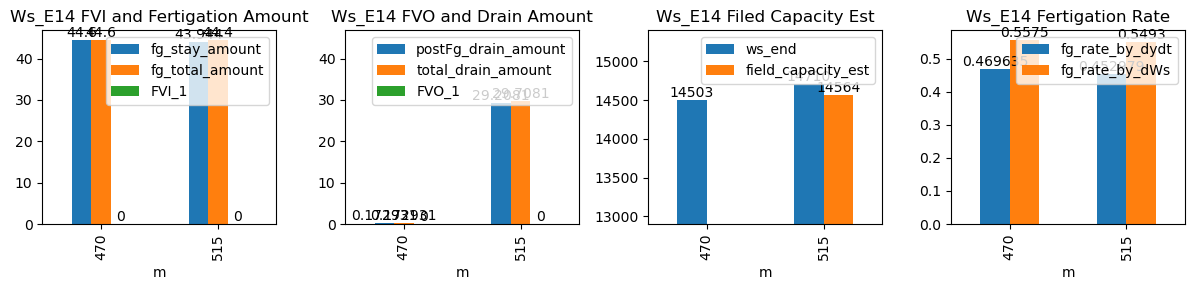
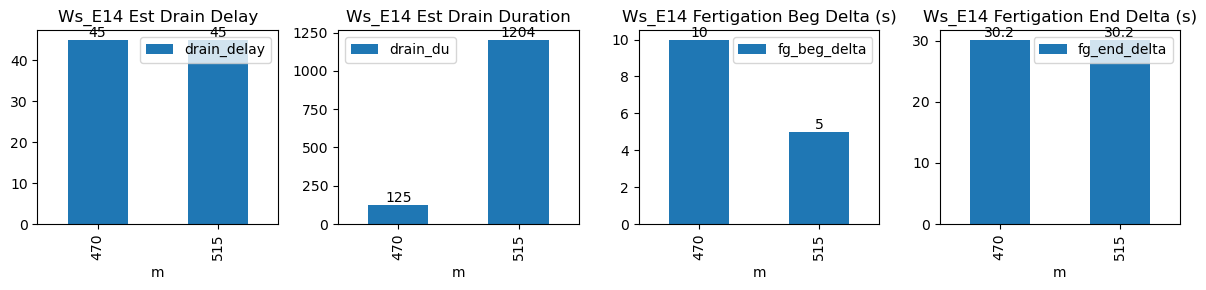
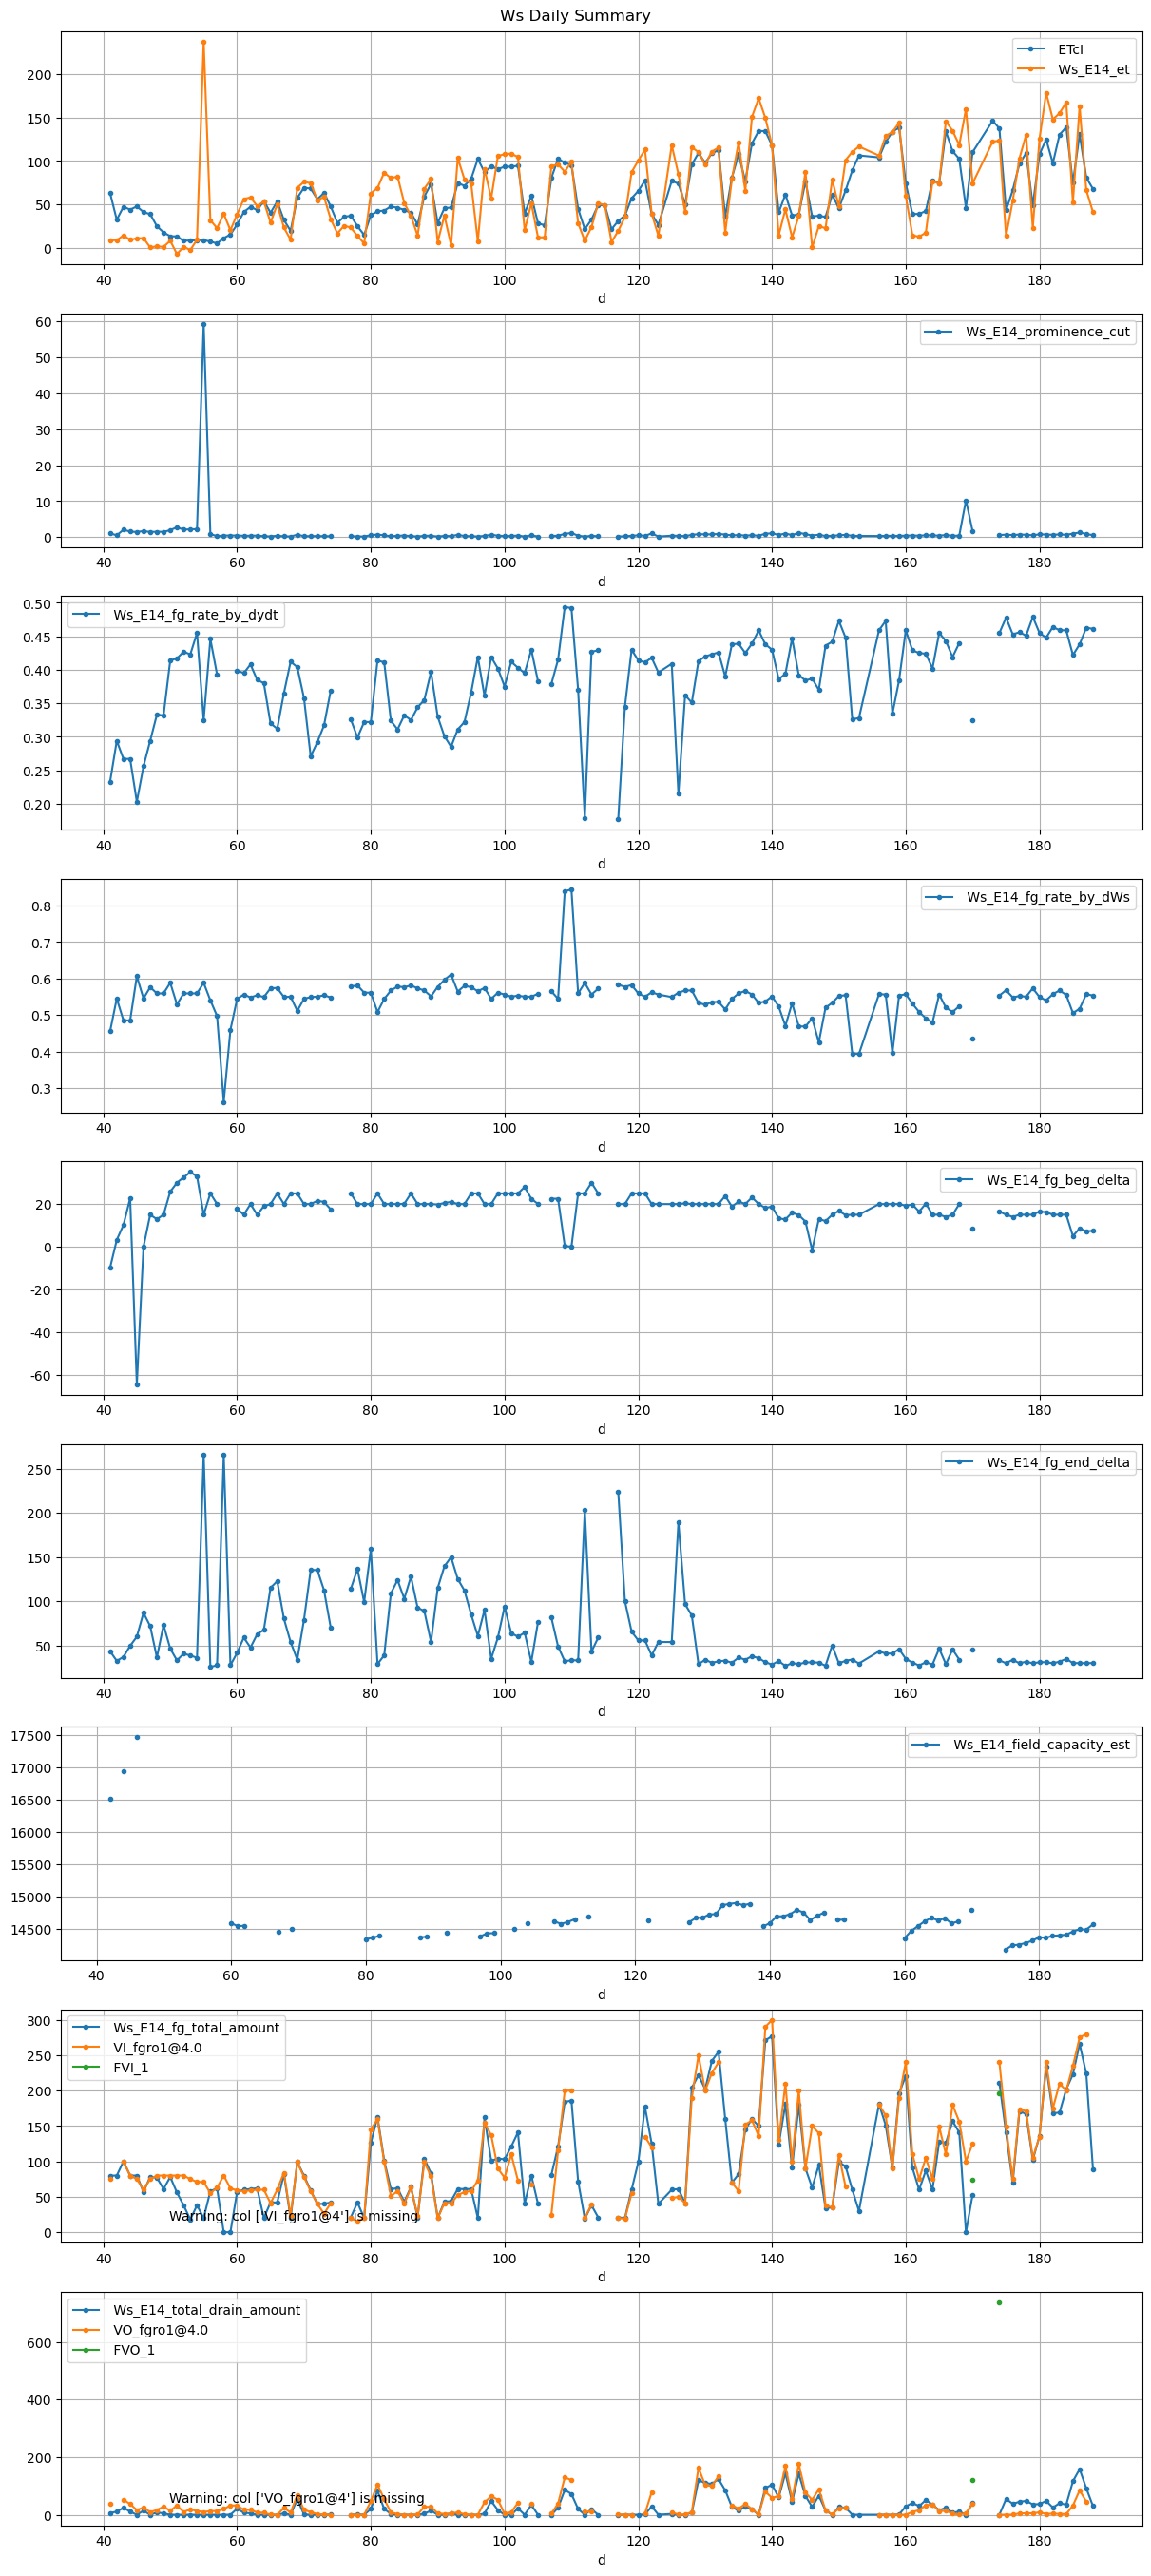
| ds | d | m | ws_name | prominence_cut | max_drain_du | fg_beg | fg_beg_est | fg_end | fg_end_est | ws_beg | ws_end | duc | pre_fg_et | post_fg_ws | post_drn_et | fg_rate_by_dydt | fg_rate_by_dWs | fg_stay_amount | enough_data | fg_beg_delta | fg_end_delta | fg_total_amount | fg_drain_amount | postFg_drain_amount | total_drain_amount | drain_du | drain_delay | drain_rate | field_capacity_est | FVI_1 | FVO_1 |
|---|---|---|---|---|---|---|---|---|---|---|---|---|---|---|---|---|---|---|---|---|---|---|---|---|---|---|---|---|---|---|---|
| 2026-04-12 07:50:00+08:00 | 188 | 470 | Ws_E14 | 0.515322 | 30 | 470.0 | 470.166667 | 471.33 | 471.833333 | 14280.00 | 14503.0 | 80 | -0.024388 | -0.062685 | -0.017118 | 0.469635 | 0.5575 | 44.600 | True | 10.0 | 30.2 | 44.6 | 0.0 | 0.172931 | 0.172931 | 125 | 45 | -0.276177 | NaN | NaN | NaN |
| 2026-04-12 08:35:00+08:00 | 188 | 515 | Ws_E14 | 0.515322 | 30 | 515.0 | 515.083333 | 516.33 | 516.833333 | 14490.28 | 14710.0 | 80 | 0.000000 | -0.931296 | -0.108477 | 0.452979 | 0.5493 | 43.944 | True | 5.0 | 30.2 | 44.4 | 0.5 | 29.208099 | 29.708099 | 1204 | 45 | -2.807462 | 14563.959505 | NaN | NaN |