| 2026-04-13 07:40:00+08:00 |
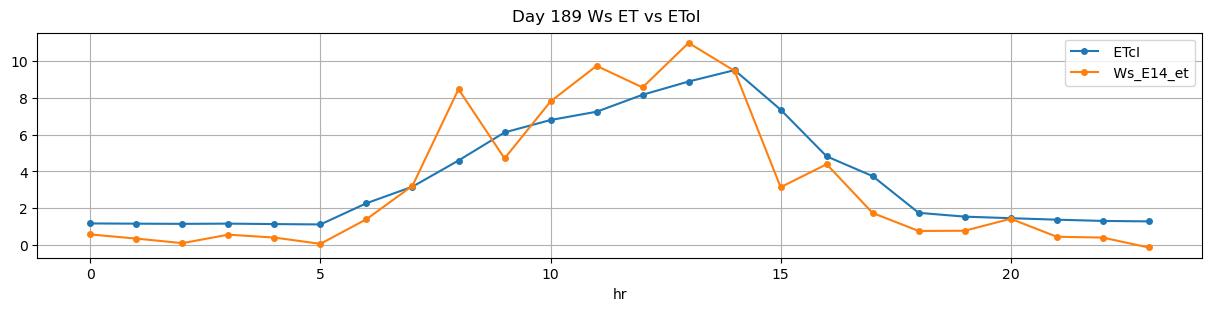
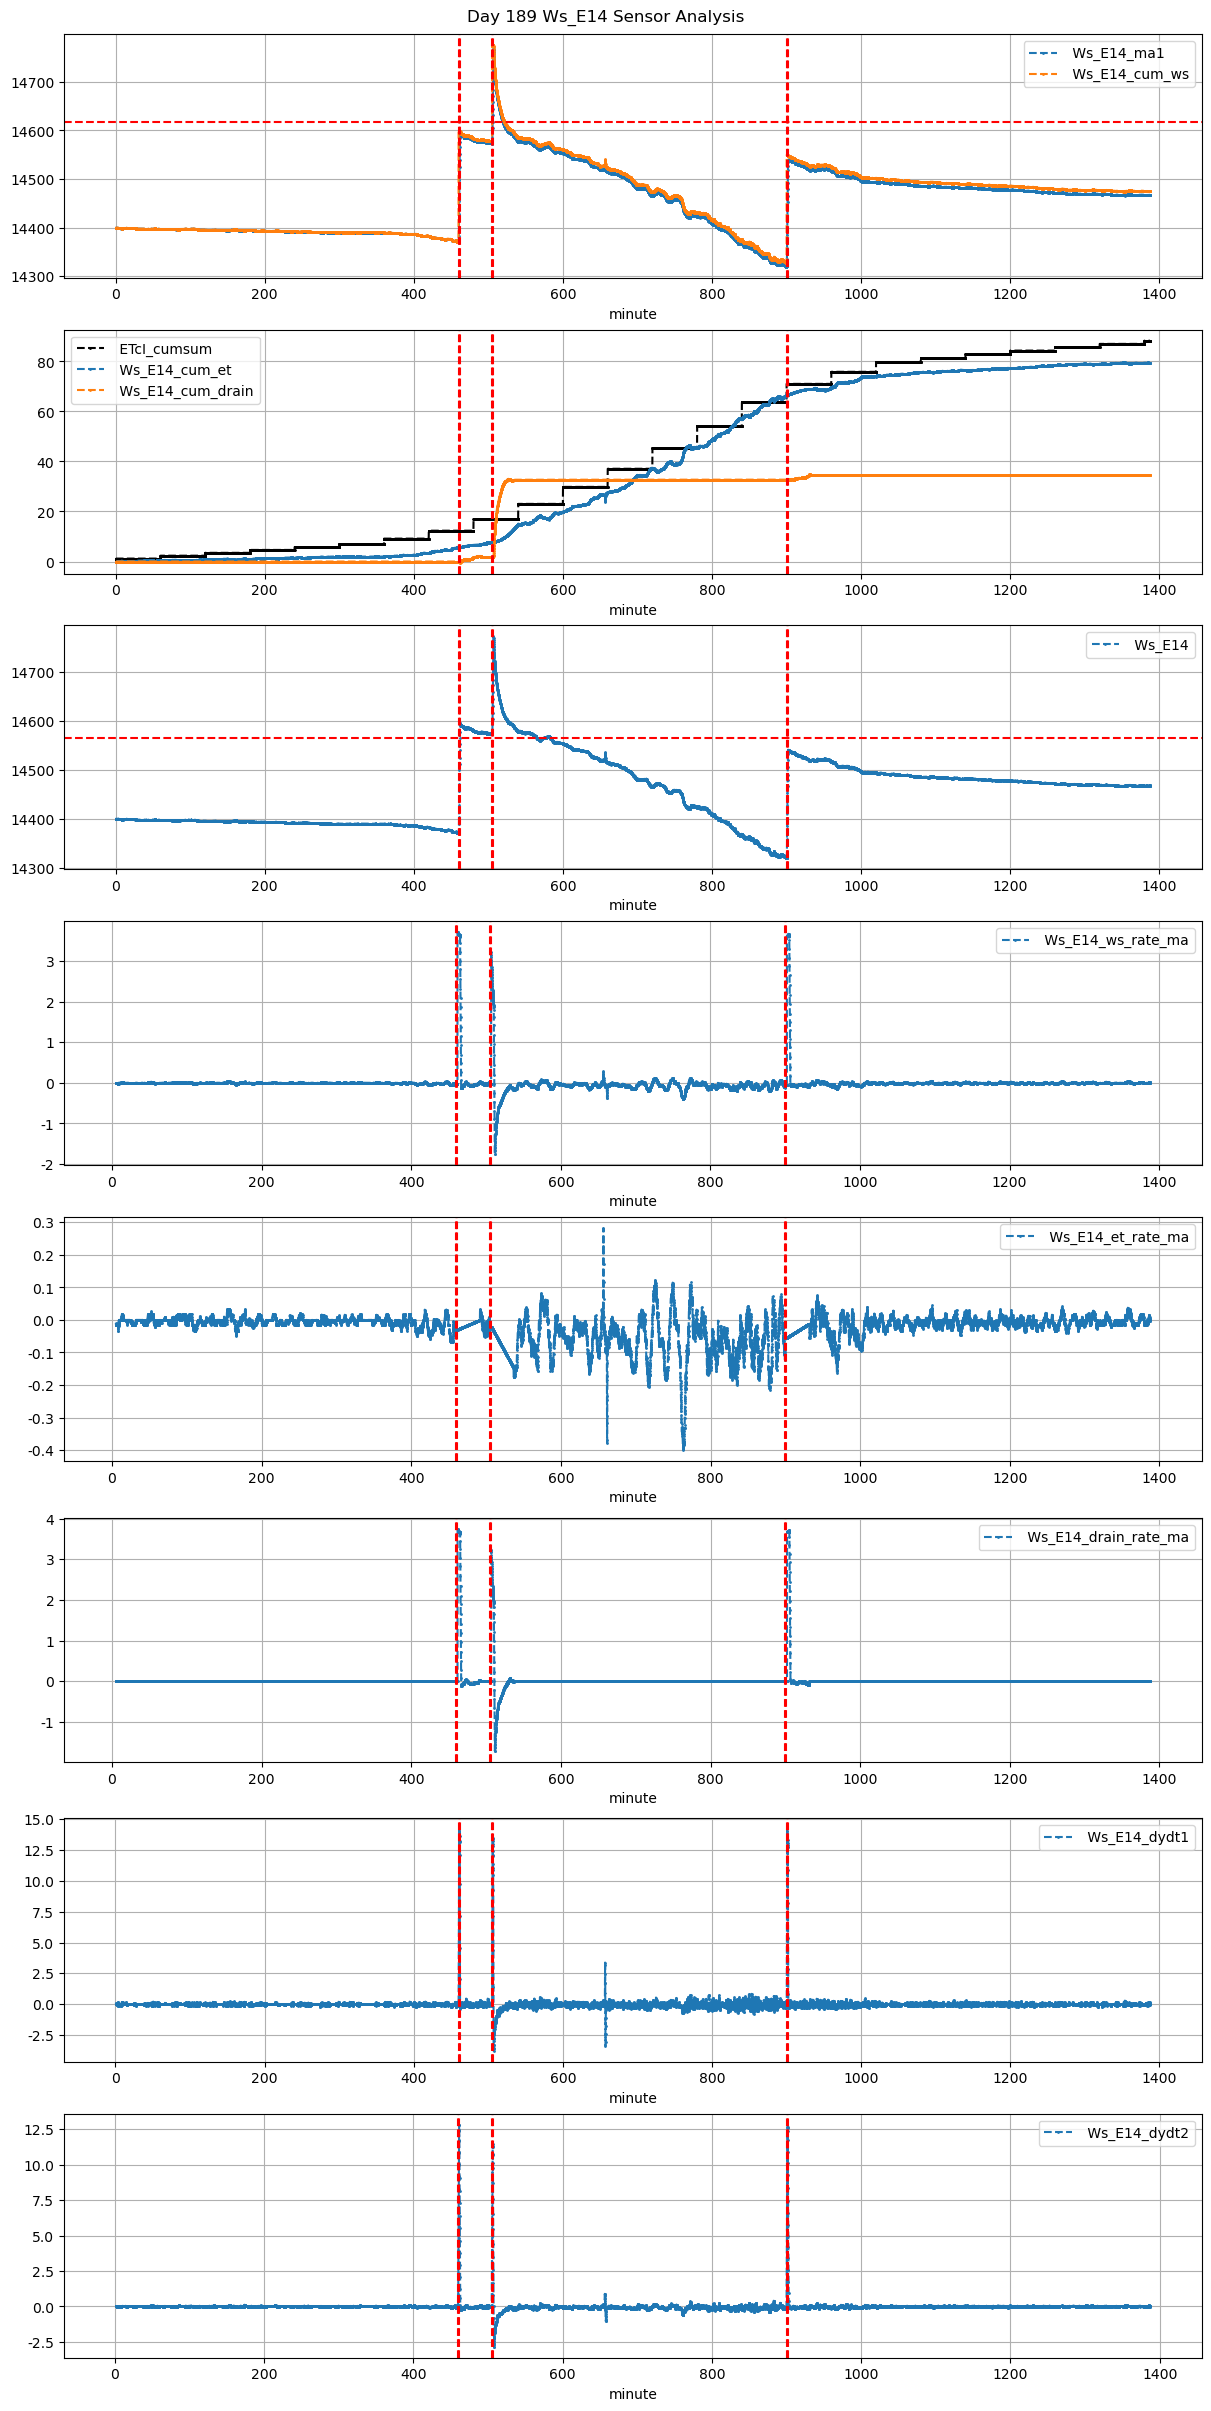
189 |
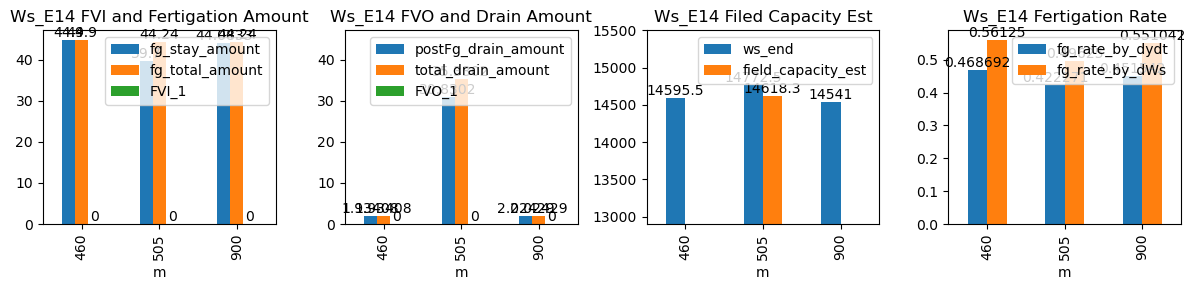
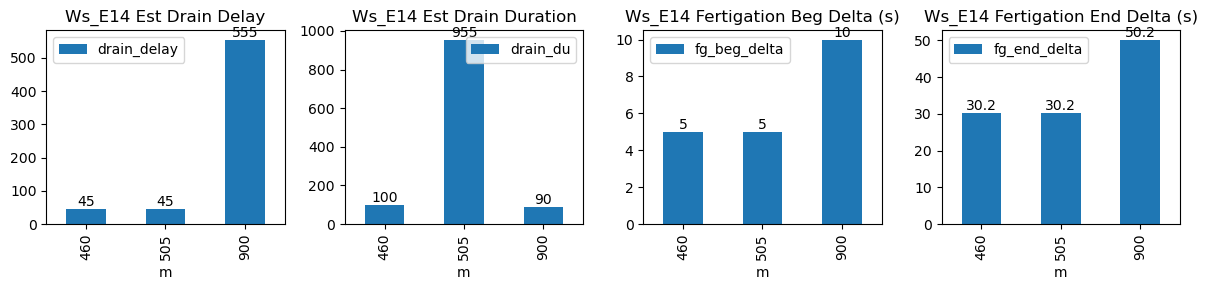
460 |
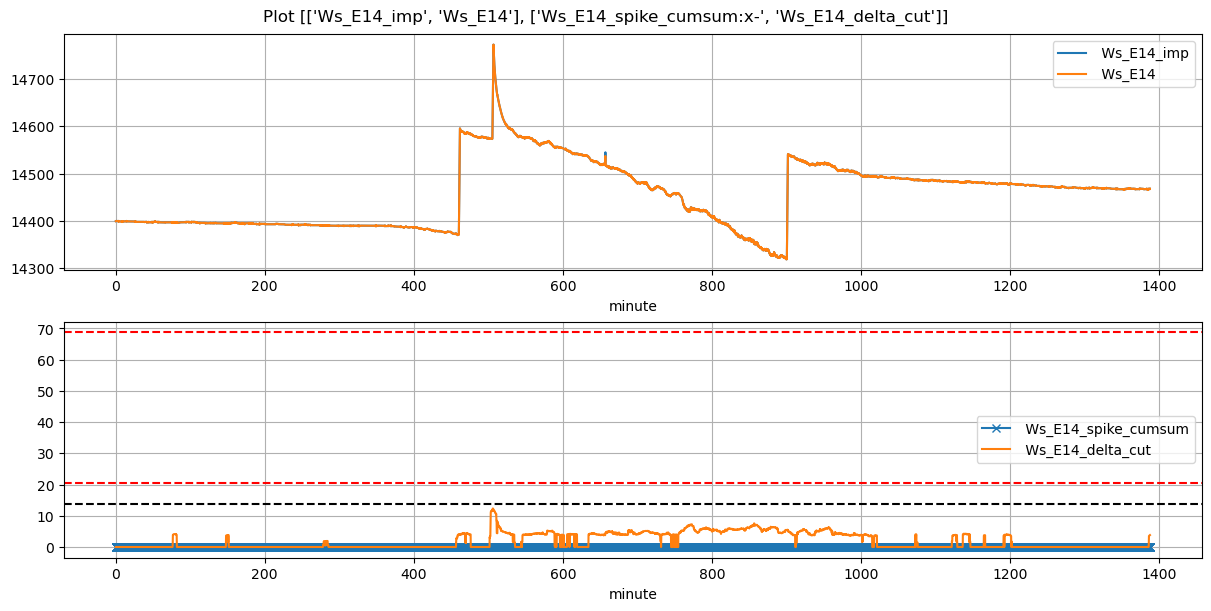
Ws_E14 |
0.623947 |
30 |
460.0 |
460.083333 |
461.33 |
461.833333 |
14371.000000 |
14595.5 |
80 |
-0.029595 |
-0.079109 |
0.000000 |
0.468692 |
0.561250 |
44.900000 |
True |
5.0 |
30.2 |
44.90 |
0.0 |
1.934076 |
1.934076 |
100 |
45 |
-0.252287 |
NaN |
NaN |
NaN |
| 2026-04-13 08:25:00+08:00 |
189 |
505 |
Ws_E14 |
0.623947 |
30 |
505.0 |
505.083333 |
506.33 |
506.833333 |
14574.000000 |
14772.5 |
80 |
-0.020387 |
-0.991181 |
-0.147306 |
0.422271 |
0.496250 |
39.700000 |
True |
5.0 |
30.2 |
44.24 |
4.5 |
30.830170 |
35.330170 |
955 |
45 |
-3.352454 |
14618.349149 |
NaN |
NaN |
| 2026-04-13 15:00:00+08:00 |
189 |
900 |
Ws_E14 |
0.623947 |
30 |
900.0 |
900.166667 |
901.33 |
902.166667 |
14320.583333 |
14541.0 |
80 |
-0.054158 |
-0.056139 |
-0.011096 |
0.451542 |
0.551042 |
44.083333 |
True |
10.0 |
50.2 |
44.24 |
0.0 |
2.024285 |
2.024285 |
90 |
555 |
-0.318349 |
NaN |
NaN |
NaN |