| 2026-01-17 09:10:00+08:00 |
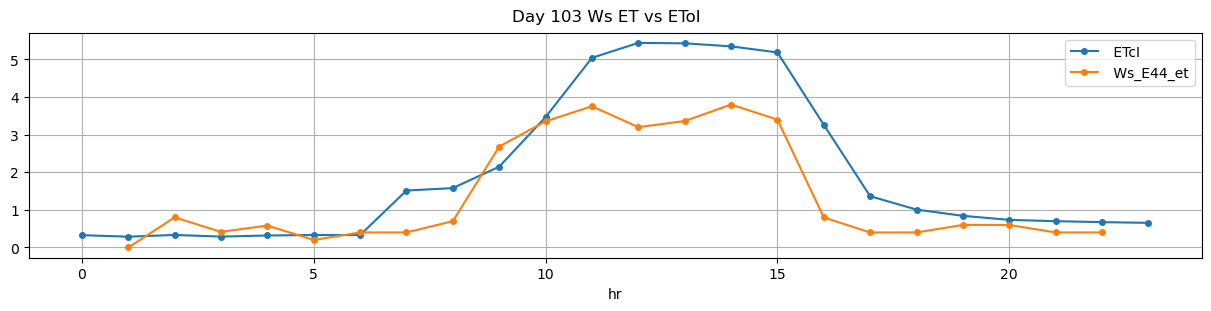
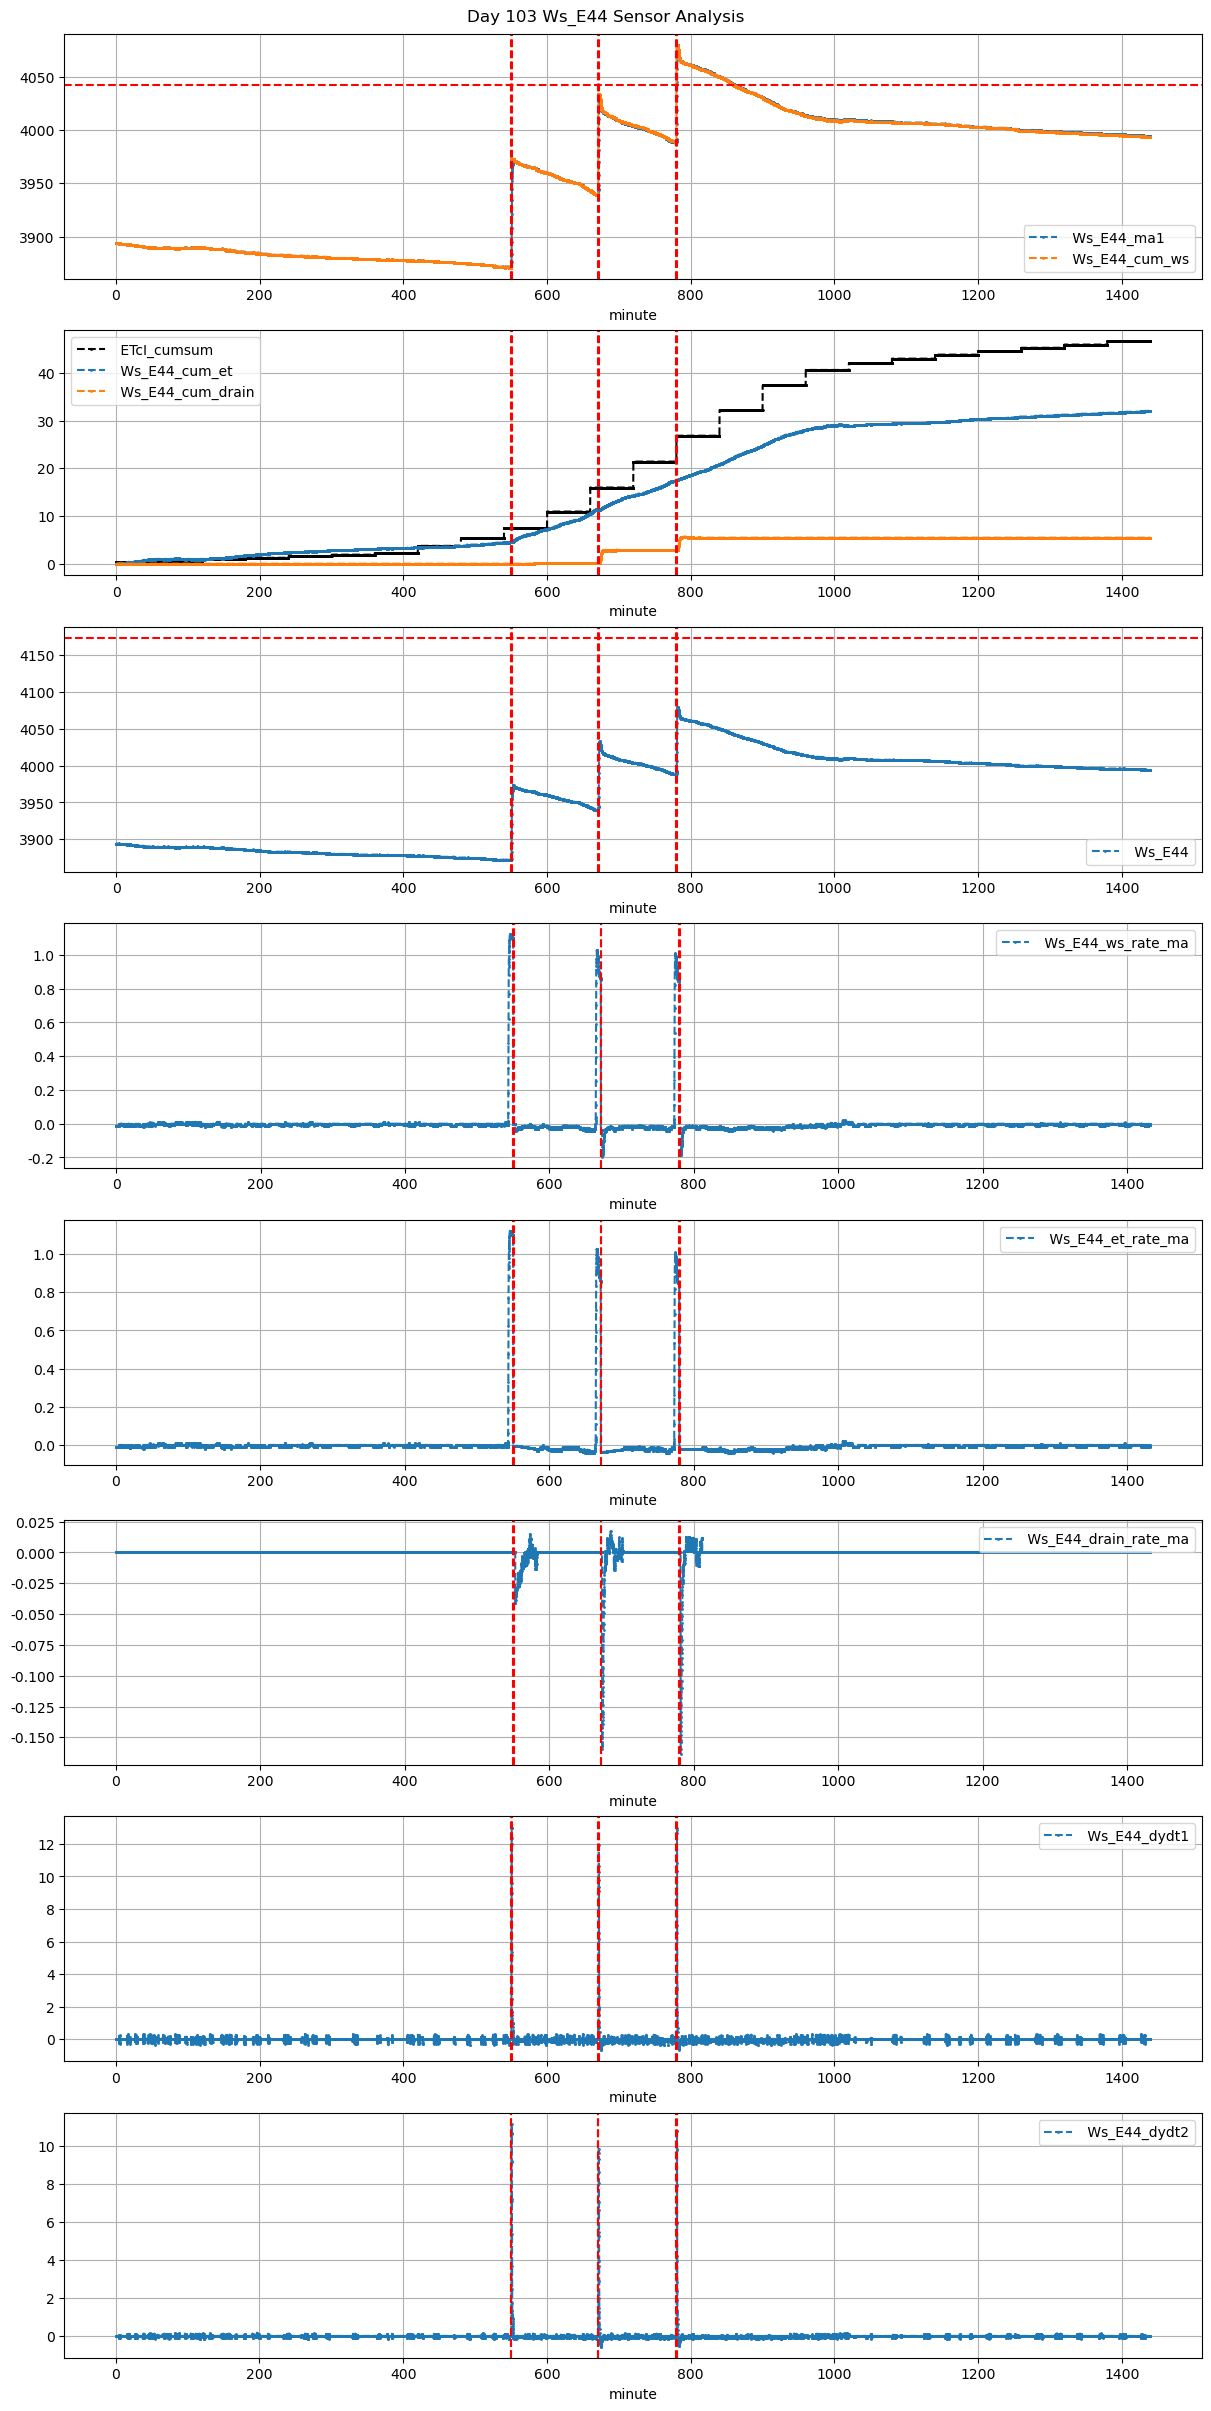
103 |
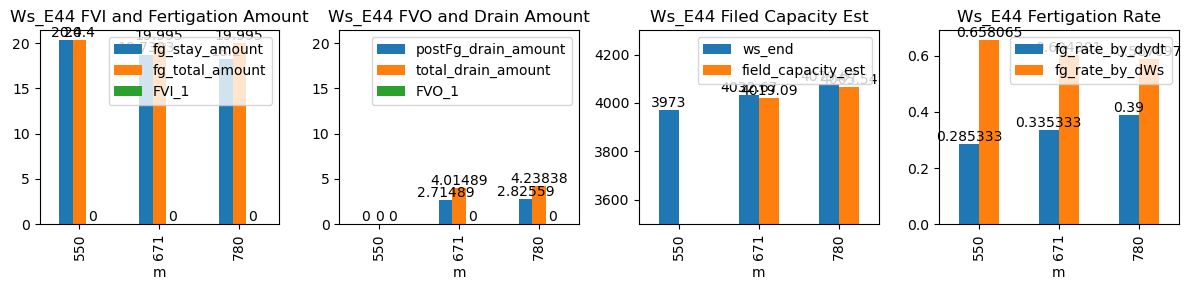
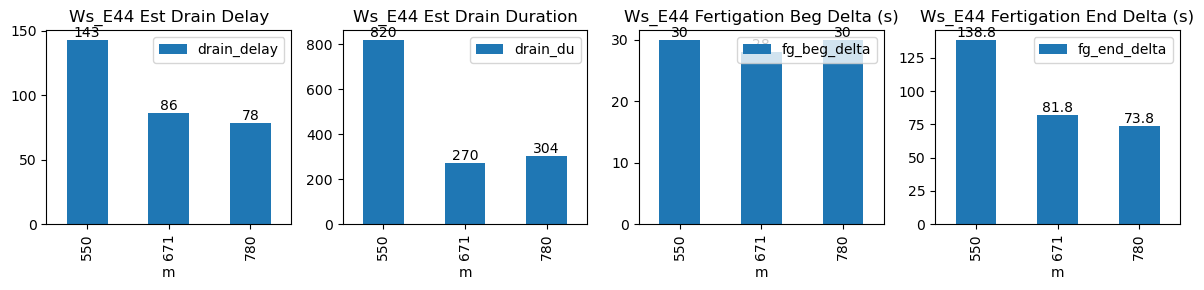
550 |
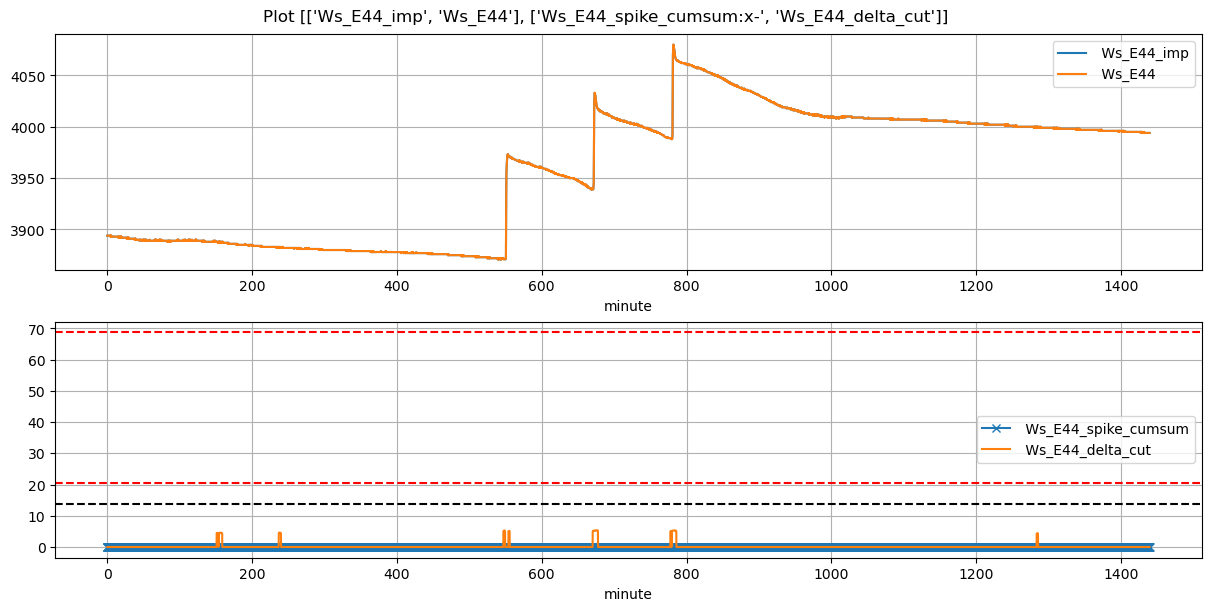
Ws_E44 |
0.209444 |
30 |
550.0 |
550.500000 |
550.52 |
552.833333 |
3871.000000 |
3973.000000 |
31 |
-0.003068 |
-0.030864 |
-0.021303 |
0.285333 |
0.658065 |
20.400000 |
True |
30.0 |
138.8 |
20.400 |
0.000000 |
0.00000 |
0.000000 |
820 |
143 |
-0.033188 |
NaN |
NaN |
NaN |
| 2026-01-17 11:11:12+08:00 |
103 |
671 |
Ws_E44 |
0.209444 |
30 |
671.2 |
671.666667 |
671.72 |
673.083333 |
3939.000000 |
4032.666667 |
31 |
-0.037697 |
-0.077562 |
-0.022668 |
0.335333 |
0.604301 |
18.733333 |
True |
28.0 |
81.8 |
19.995 |
1.300000 |
2.71489 |
4.014890 |
270 |
86 |
-0.136154 |
4019.092217 |
NaN |
NaN |
| 2026-01-17 13:00:00+08:00 |
103 |
780 |
Ws_E44 |
0.209444 |
30 |
780.0 |
780.500000 |
780.52 |
781.750000 |
3988.666667 |
4079.666667 |
31 |
-0.023772 |
-0.064733 |
-0.022414 |
0.390000 |
0.587097 |
18.200000 |
True |
30.0 |
73.8 |
19.995 |
1.412795 |
2.82559 |
4.238385 |
304 |
78 |
-0.148473 |
4065.538717 |
NaN |
NaN |