VI and VO Daily Summary
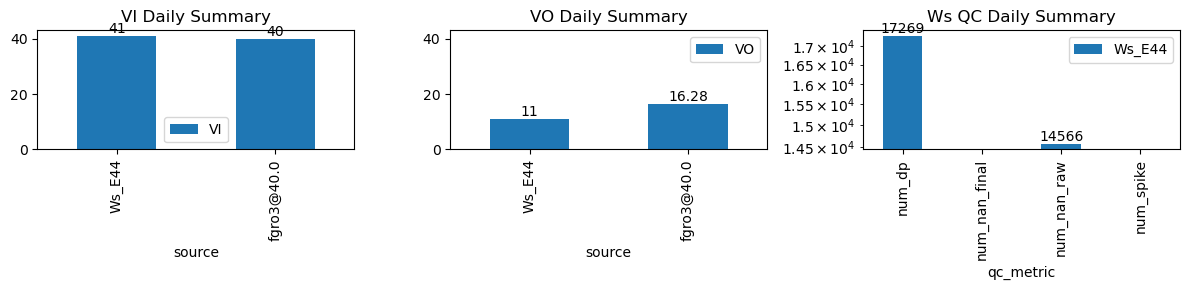
| ws_name | num_dp | num_nan_raw | num_nan_final | num_spike | cum_step_adj |
|---|---|---|---|---|---|
| Ws_E44 | 17,269 | 14,566 | 0 | 0 | 0.00 |
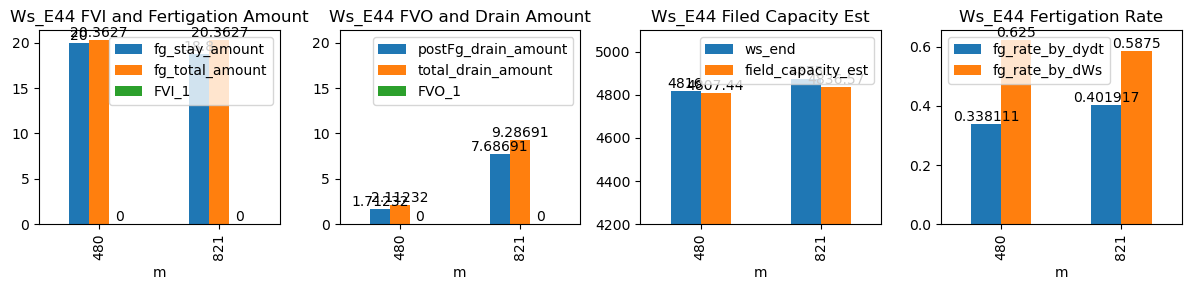
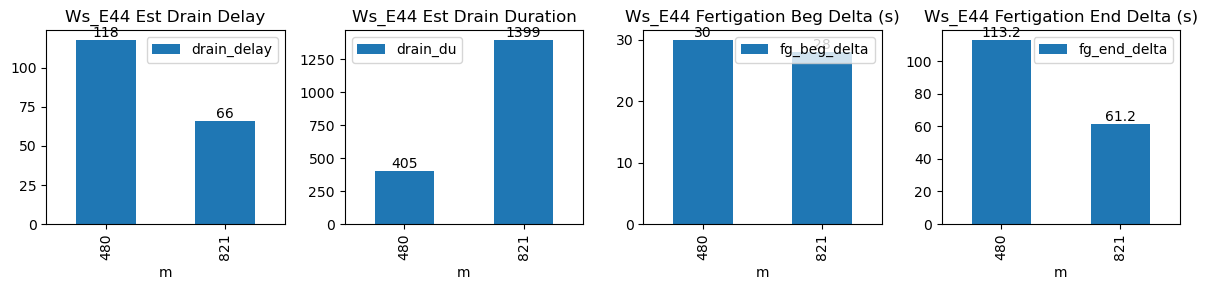
| ds | d | m | ws_name | prominence_cut | max_drain_du | fg_beg | fg_beg_est | fg_end | fg_end_est | ws_beg | ws_end | duc | pre_fg_et | post_fg_ws | post_drn_et | fg_rate_by_dydt | fg_rate_by_dWs | fg_stay_amount | enough_data | fg_beg_delta | fg_end_delta | fg_total_amount | fg_drain_amount | postFg_drain_amount | total_drain_amount | drain_du | drain_delay | drain_rate | field_capacity_est | FVI_1 | FVO_1 |
|---|---|---|---|---|---|---|---|---|---|---|---|---|---|---|---|---|---|---|---|---|---|---|---|---|---|---|---|---|---|---|---|
| 2026-01-26 08:00:00+08:00 | 112 | 480 | Ws_E44 | 0.246397 | 30 | 480.0 | 480.500000 | 480.53 | 482.416667 | 4716.0 | 4816.0 | 32 | -0.003307 | -0.031173 | -0.007778 | 0.338111 | 0.6250 | 20.0 | True | 30.0 | 113.2 | 20.362667 | 0.4 | 1.712318 | 2.112318 | 405 | 118 | -0.063203 | 4807.438408 | NaN | NaN |
| 2026-01-26 13:41:12+08:00 | 112 | 821 | Ws_E44 | 0.246397 | 30 | 821.2 | 821.666667 | 821.73 | 822.750000 | 4781.0 | 4875.0 | 32 | -0.007130 | -0.123457 | -0.012222 | 0.401917 | 0.5875 | 18.8 | True | 28.0 | 61.2 | 20.362667 | 1.6 | 7.686906 | 9.286906 | 1399 | 66 | -0.199977 | 4836.565469 | NaN | NaN |