| 2026-01-27 10:40:00+08:00 |
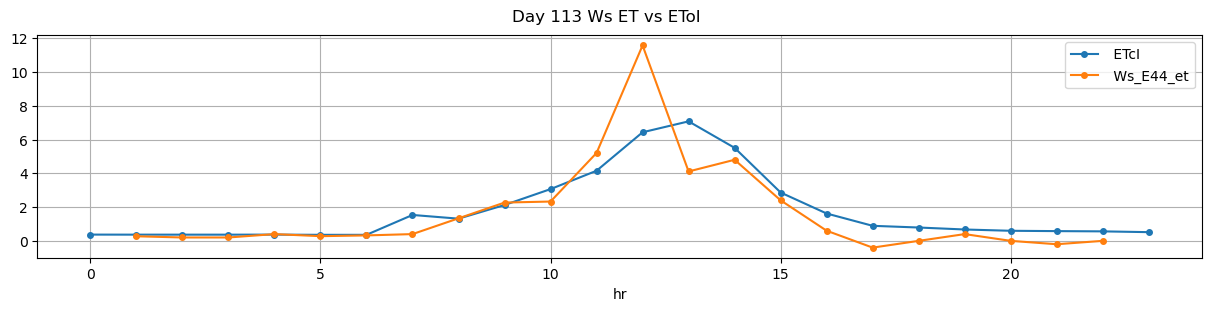
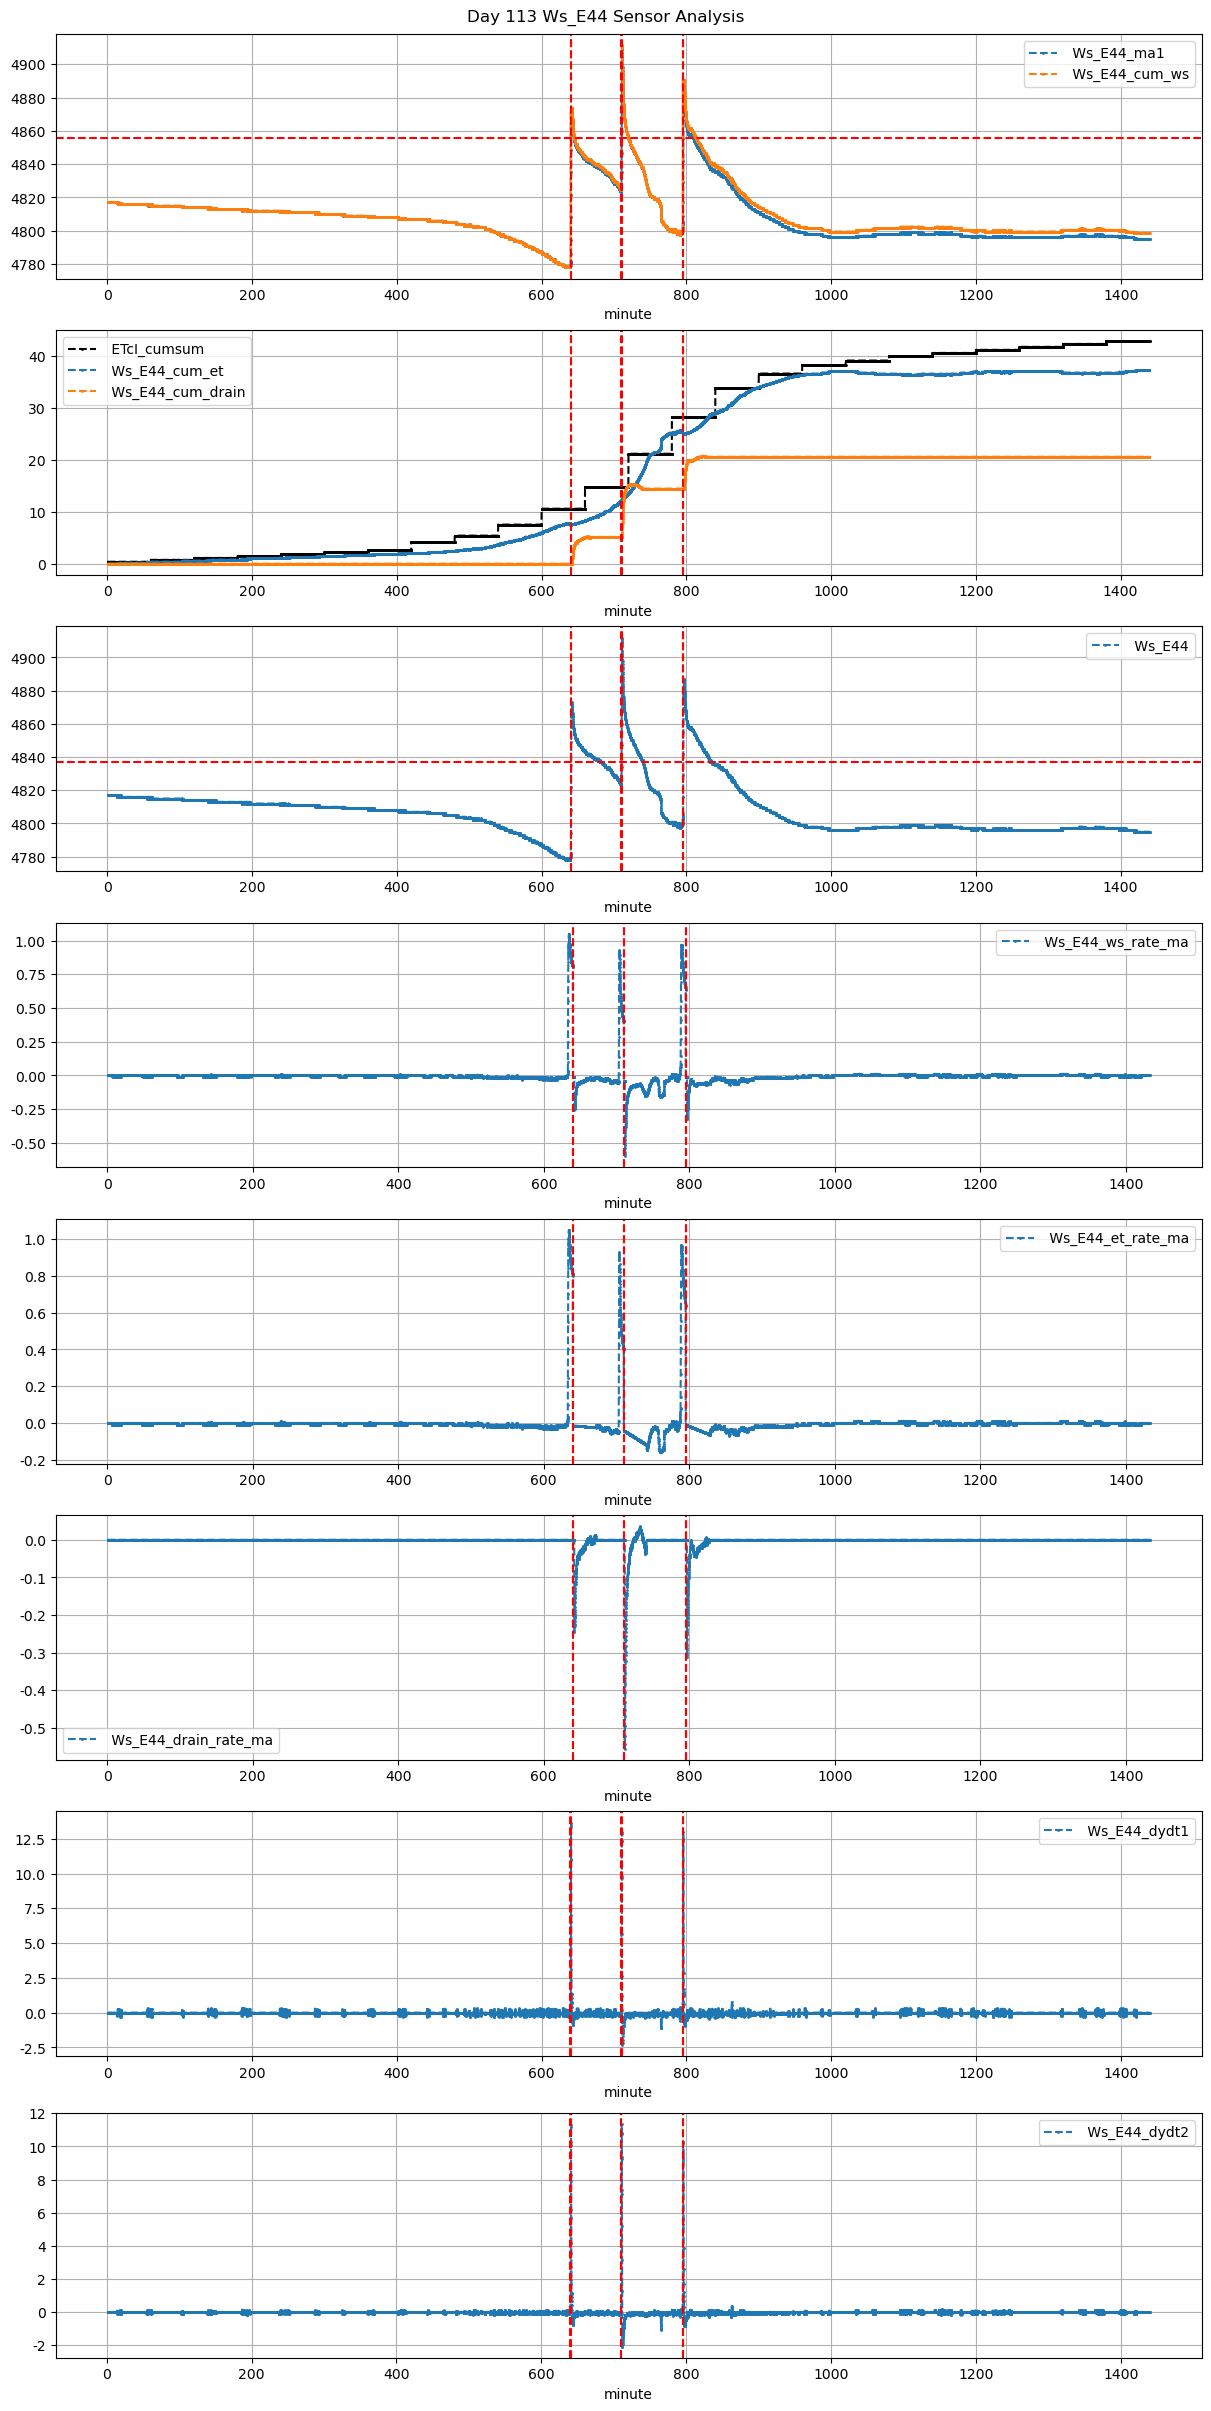
113 |
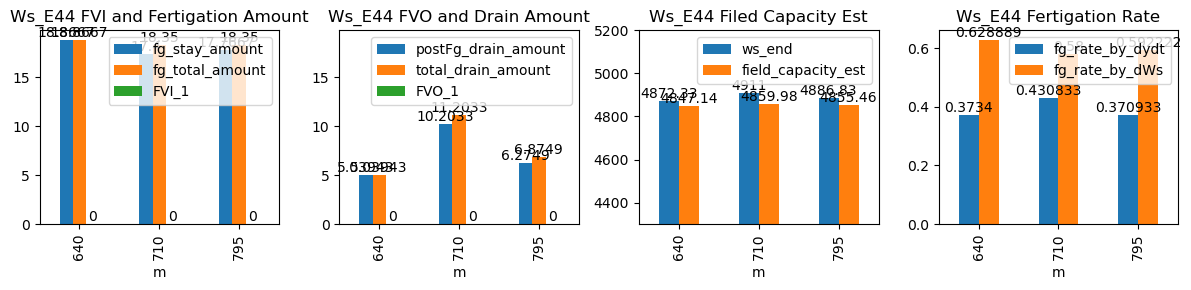
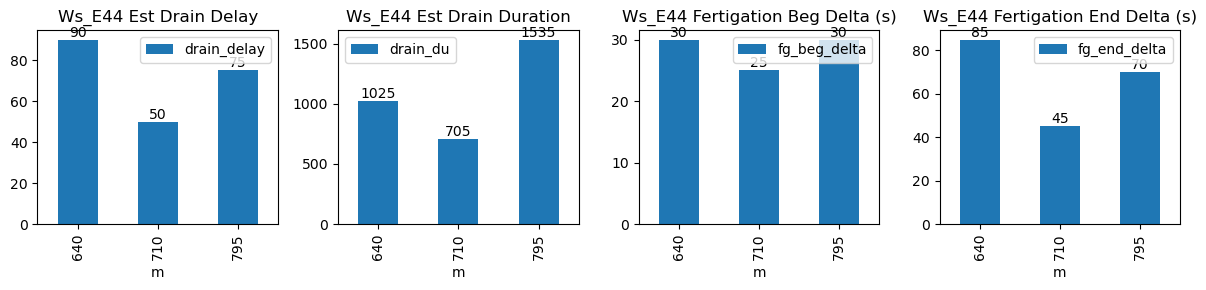
640 |
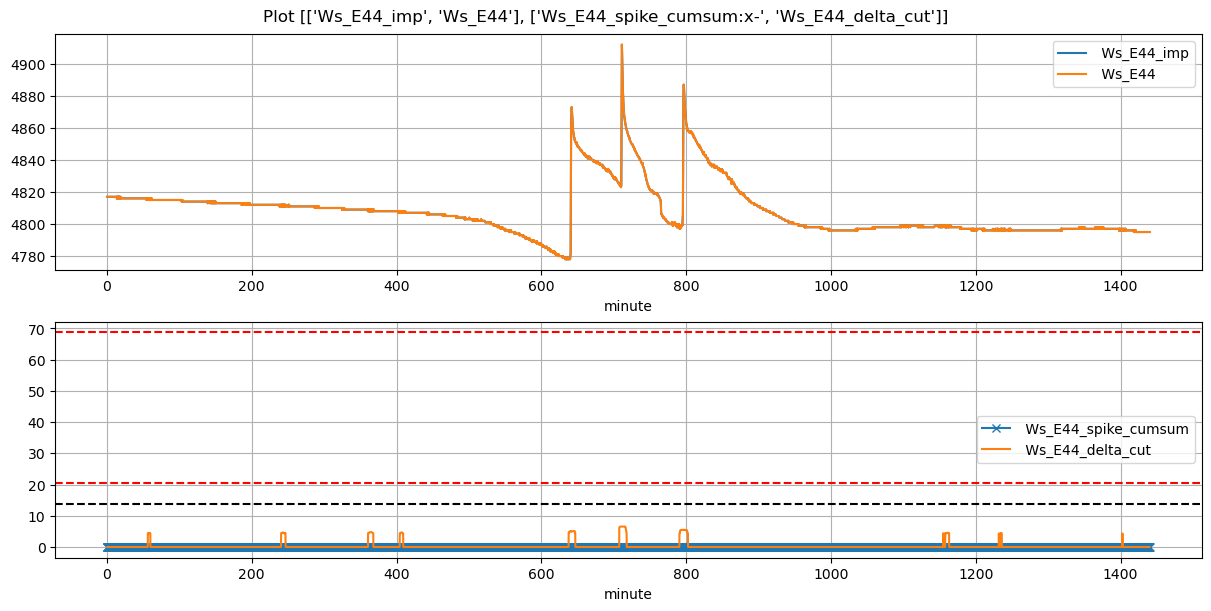
Ws_E44 |
0.414399 |
30 |
640.0 |
640.500000 |
640.5 |
641.916667 |
4778.0 |
4872.333333 |
30 |
-0.013895 |
-0.102128 |
-0.024679 |
0.373400 |
0.628889 |
18.866667 |
True |
30.0 |
85.0 |
18.866667 |
0.0 |
5.039430 |
5.039430 |
1025 |
90 |
-0.152852 |
4847.136185 |
NaN |
NaN |
| 2026-01-27 11:50:00+08:00 |
113 |
710 |
Ws_E44 |
0.414399 |
30 |
710.0 |
710.416667 |
710.5 |
711.250000 |
4824.0 |
4911.000000 |
30 |
-0.044060 |
-0.210926 |
-0.118673 |
0.430833 |
0.580000 |
17.400000 |
True |
25.0 |
45.0 |
18.350000 |
1.0 |
10.203344 |
11.203344 |
705 |
50 |
-0.355383 |
4859.983282 |
NaN |
NaN |
| 2026-01-27 13:15:00+08:00 |
113 |
795 |
Ws_E44 |
0.414399 |
30 |
795.0 |
795.500000 |
795.5 |
796.666667 |
4798.0 |
4886.833333 |
30 |
-0.013143 |
-0.106224 |
-0.059691 |
0.370933 |
0.592222 |
17.766667 |
True |
30.0 |
70.0 |
18.350000 |
0.6 |
6.274900 |
6.874900 |
1535 |
75 |
-0.172738 |
4855.458831 |
NaN |
NaN |