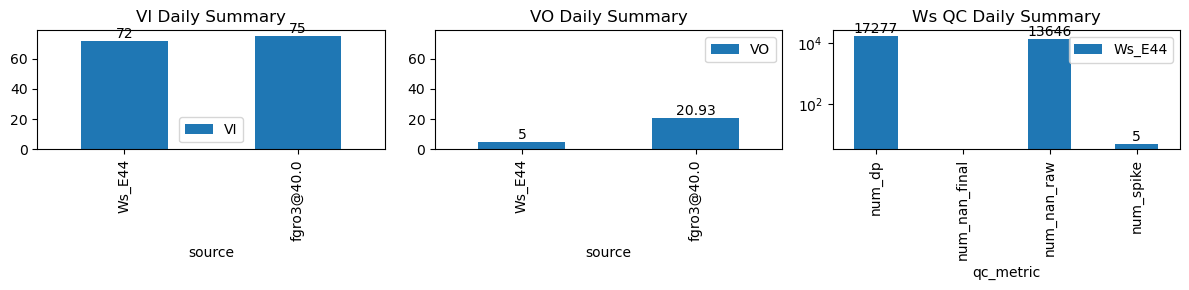
VI and VO Daily Summary
| ws_name | num_dp | num_nan_raw | num_nan_final | num_spike | cum_step_adj |
|---|---|---|---|---|---|
| Ws_E44 | 17,277 | 13,646 | 0 | 5 | 0.00 |
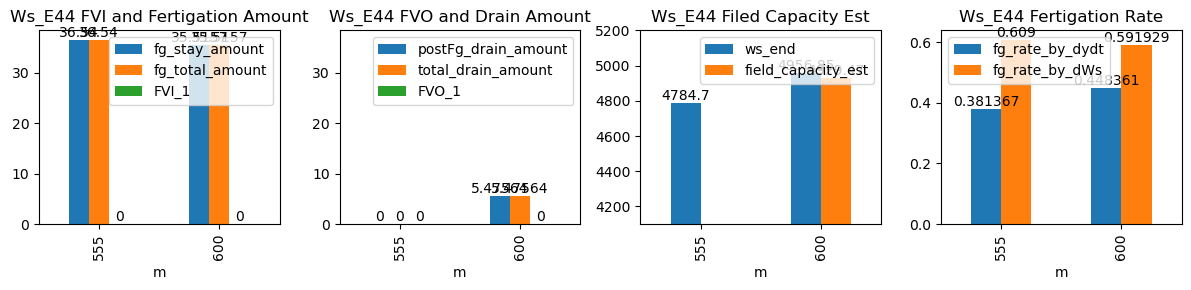
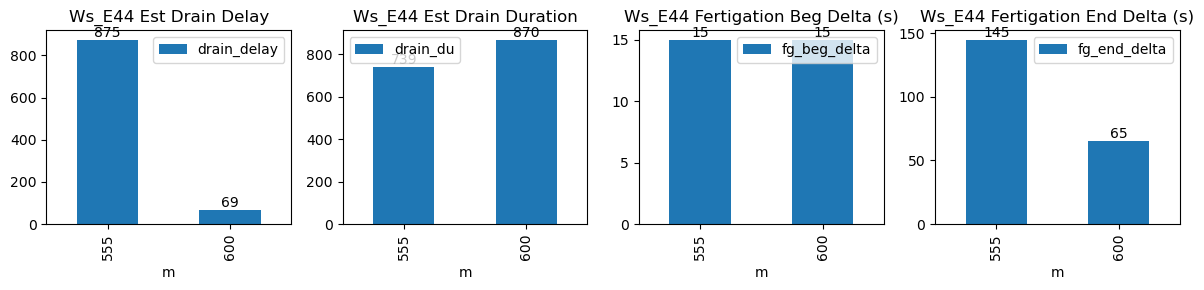
| ds | d | m | ws_name | prominence_cut | max_drain_du | fg_beg | fg_beg_est | fg_end | fg_end_est | ws_beg | ws_end | duc | pre_fg_et | post_fg_ws | post_drn_et | fg_rate_by_dydt | fg_rate_by_dWs | fg_stay_amount | enough_data | fg_beg_delta | fg_end_delta | fg_total_amount | fg_drain_amount | postFg_drain_amount | total_drain_amount | drain_du | drain_delay | drain_rate | field_capacity_est | FVI_1 | FVO_1 |
|---|---|---|---|---|---|---|---|---|---|---|---|---|---|---|---|---|---|---|---|---|---|---|---|---|---|---|---|---|---|---|---|
| 2026-03-30 09:15:00+08:00 | 175 | 555 | Ws_E44 | 0.189912 | 30 | 555.0 | 555.25 | 556.0 | 558.416667 | 4602.000000 | 4784.70 | 60 | -0.004145 | -0.009681 | 0.000000 | 0.381367 | 0.609000 | 36.540000 | True | 15.0 | 145.0 | 36.540000 | 0.0 | 0.000000 | 0.000000 | 739 | 875 | -0.021089 | NaN | NaN | NaN |
| 2026-03-30 10:00:00+08:00 | 175 | 600 | Ws_E44 | 0.189912 | 30 | 600.0 | 600.25 | 601.0 | 602.083333 | 4779.271429 | 4956.85 | 60 | 0.000000 | -0.088652 | -0.025401 | 0.448361 | 0.591929 | 35.515714 | True | 15.0 | 65.0 | 35.515714 | 0.0 | 5.475644 | 5.475644 | 870 | 69 | -0.161492 | 4929.471778 | NaN | NaN |