| 2026-03-31 07:27:58+08:00 |
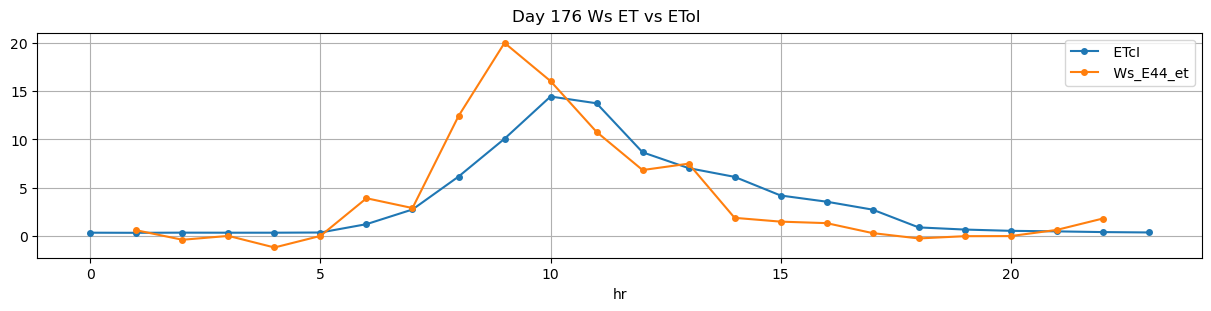
176 |
447 |
Ws_E44 |
0.769311 |
30 |
447.97 |
448.25 |
448.97 |
450.750000 |
4842.9 |
5026.600000 |
60 |
0.000000 |
-0.105216 |
-0.044023 |
0.408750 |
0.612333 |
36.740000 |
True |
16.8 |
106.8 |
36.740000 |
0.0 |
4.135932 |
4.135932 |
740 |
111 |
-0.148123 |
5005.920342 |
NaN |
NaN |
| 2026-03-31 08:11:29+08:00 |
176 |
491 |
Ws_E44 |
0.769311 |
30 |
491.48 |
491.75 |
492.48 |
493.083333 |
4986.7 |
5147.366667 |
60 |
-0.063138 |
-0.272428 |
-0.093843 |
0.464917 |
0.535556 |
32.133333 |
True |
16.2 |
36.2 |
34.456667 |
2.3 |
14.535309 |
16.835309 |
780 |
41 |
-0.287646 |
5074.690121 |
NaN |
NaN |
| 2026-03-31 08:56:29+08:00 |
176 |
536 |
Ws_E44 |
0.769311 |
30 |
536.48 |
536.75 |
537.48 |
538.000000 |
5031.4 |
5189.066667 |
60 |
-0.120185 |
-0.318145 |
-0.118098 |
0.456111 |
0.525556 |
31.533333 |
True |
16.2 |
31.2 |
34.456667 |
2.9 |
16.150267 |
19.050267 |
540 |
36 |
-0.335304 |
5108.315334 |
44.0 |
0.0 |
| 2026-03-31 14:00:00+08:00 |
176 |
840 |
Ws_E44 |
0.769311 |
30 |
840.00 |
840.25 |
841.00 |
843.250000 |
4803.0 |
4985.000000 |
60 |
-0.009389 |
-0.019565 |
-0.000391 |
0.382194 |
0.606667 |
36.400000 |
True |
15.0 |
135.0 |
36.400000 |
0.0 |
0.000000 |
0.000000 |
439 |
140 |
-0.019365 |
NaN |
NaN |
NaN |