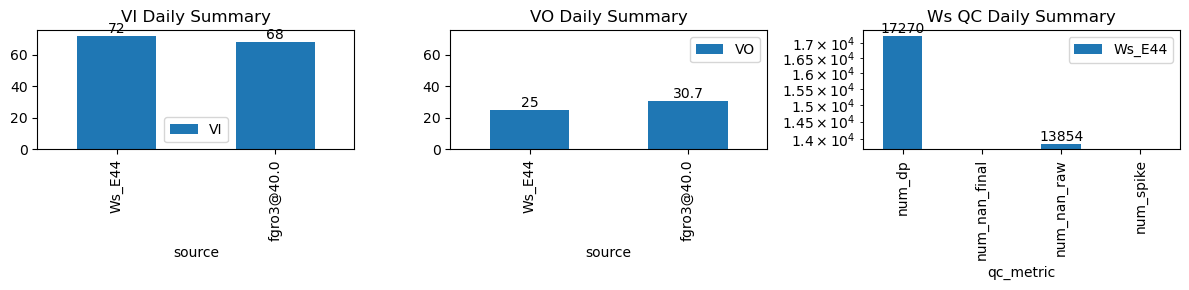
VI and VO Daily Summary
| ws_name | num_dp | num_nan_raw | num_nan_final | num_spike | cum_step_adj |
|---|---|---|---|---|---|
| Ws_E44 | 17,270 | 13,854 | 0 | 0 | 0.00 |
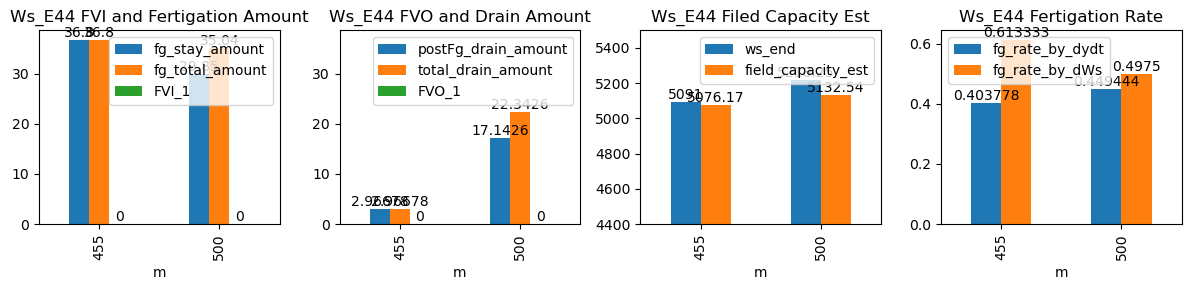
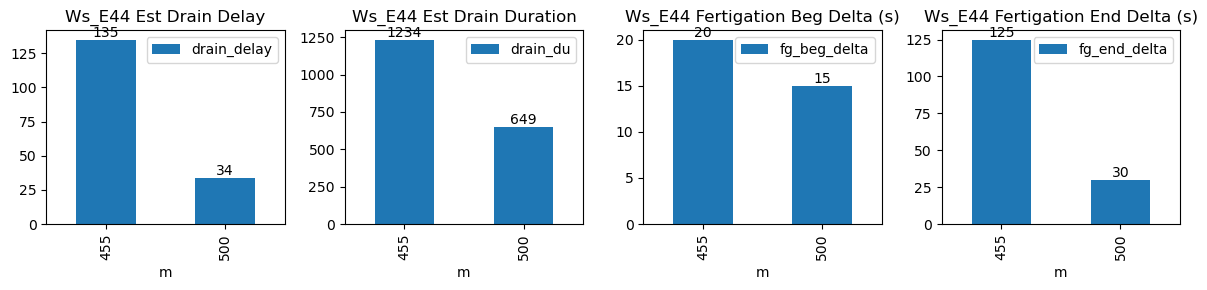
| ds | d | m | ws_name | prominence_cut | max_drain_du | fg_beg | fg_beg_est | fg_end | fg_end_est | ws_beg | ws_end | duc | pre_fg_et | post_fg_ws | post_drn_et | fg_rate_by_dydt | fg_rate_by_dWs | fg_stay_amount | enough_data | fg_beg_delta | fg_end_delta | fg_total_amount | fg_drain_amount | postFg_drain_amount | total_drain_amount | drain_du | drain_delay | drain_rate | field_capacity_est | FVI_1 | FVO_1 |
|---|---|---|---|---|---|---|---|---|---|---|---|---|---|---|---|---|---|---|---|---|---|---|---|---|---|---|---|---|---|---|---|
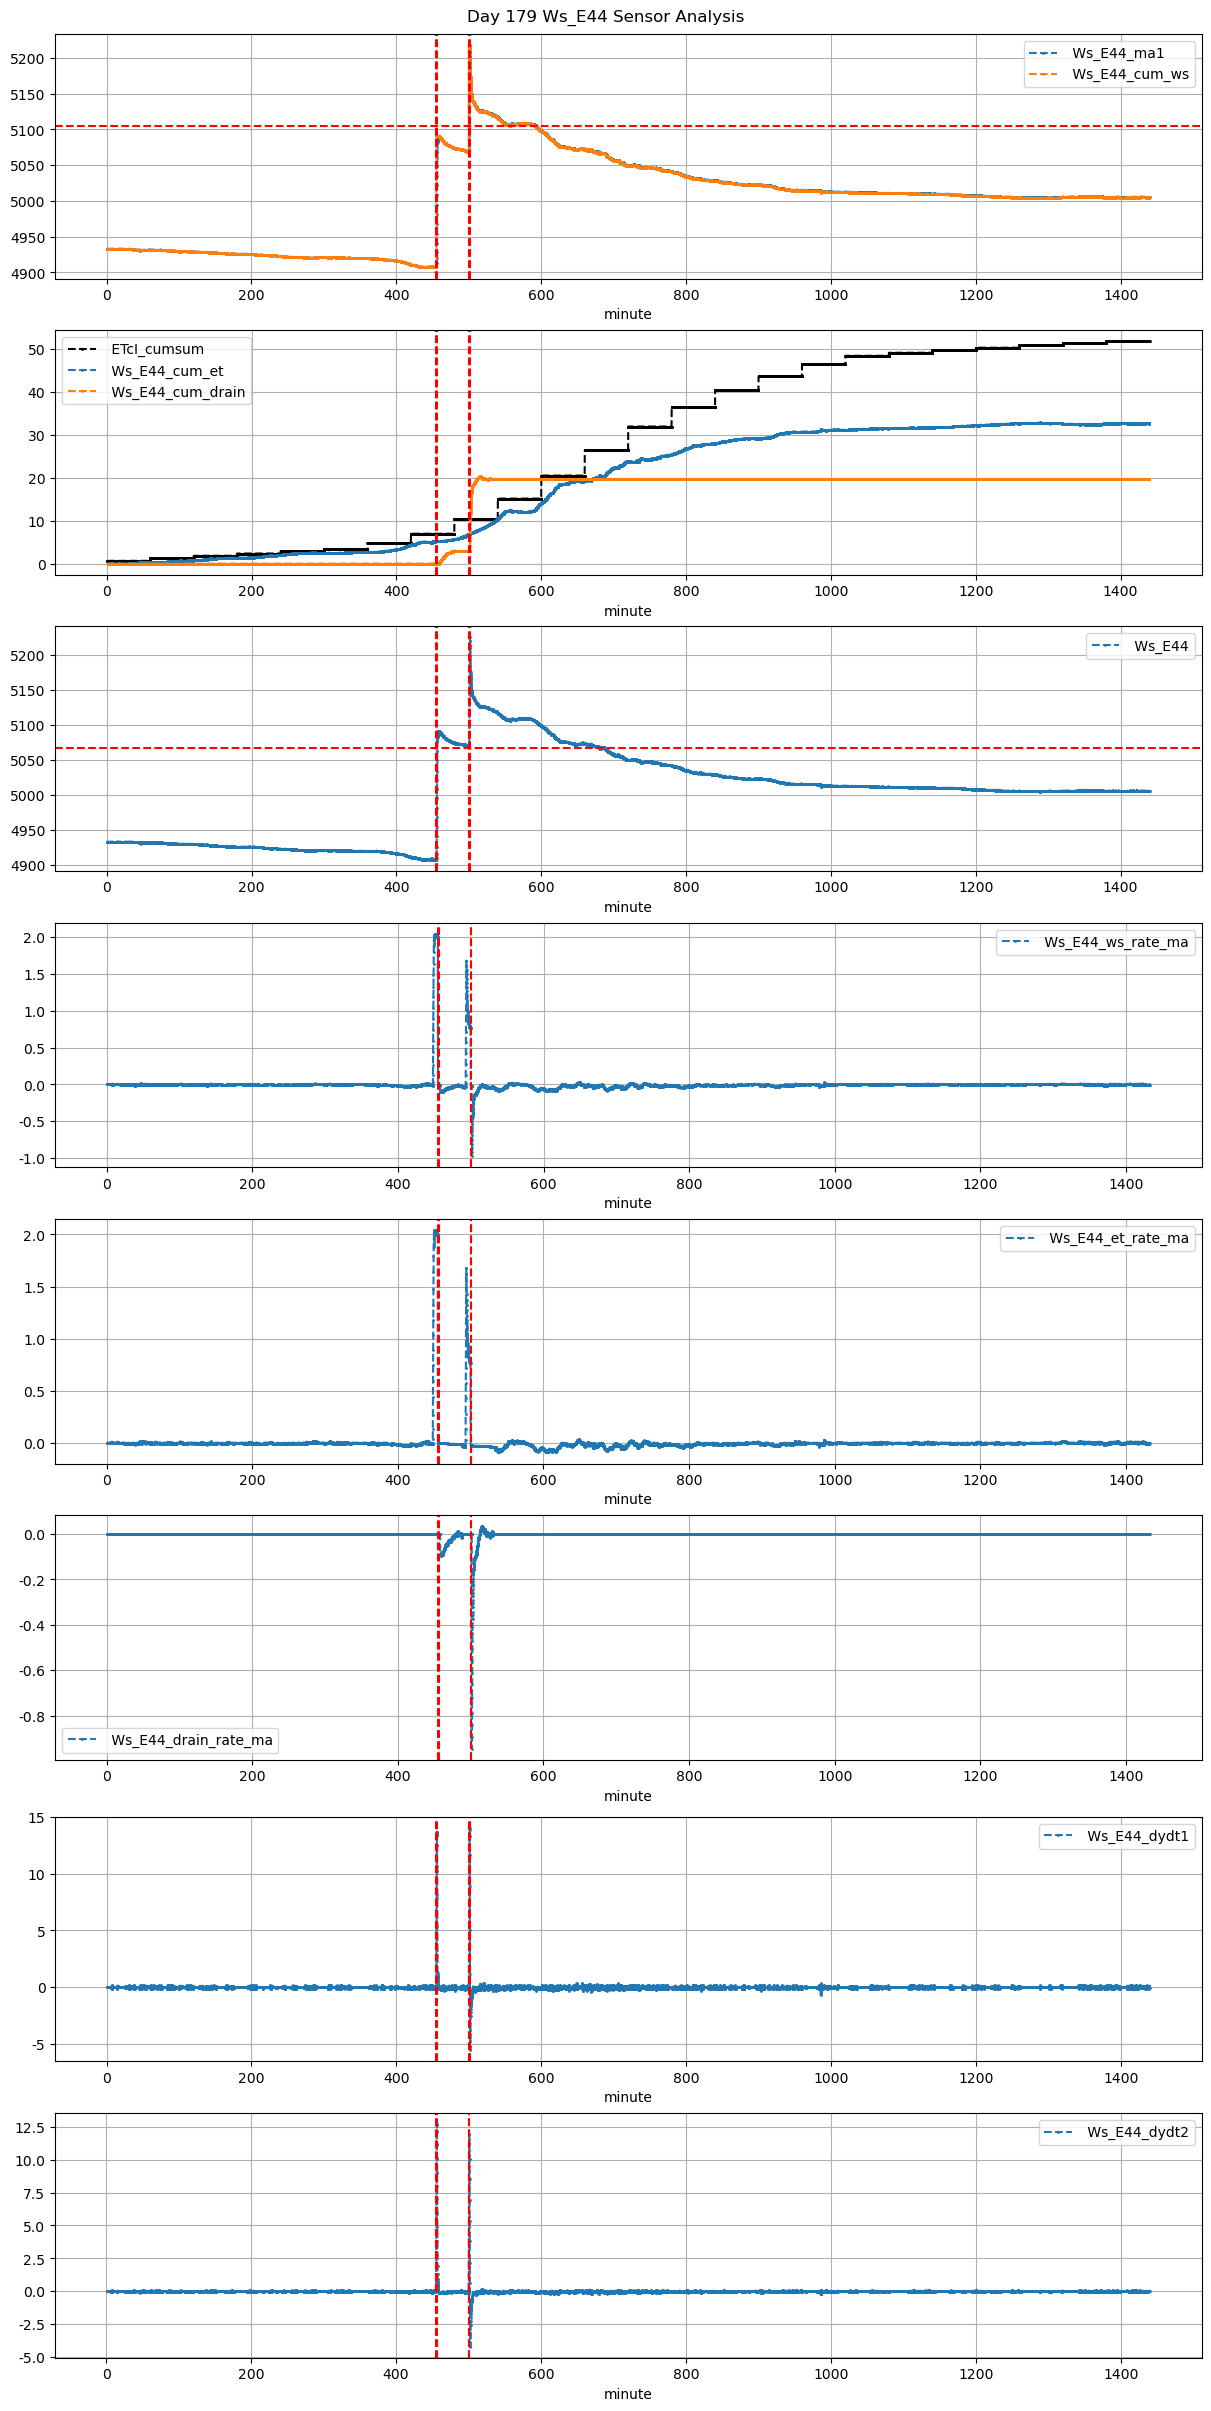
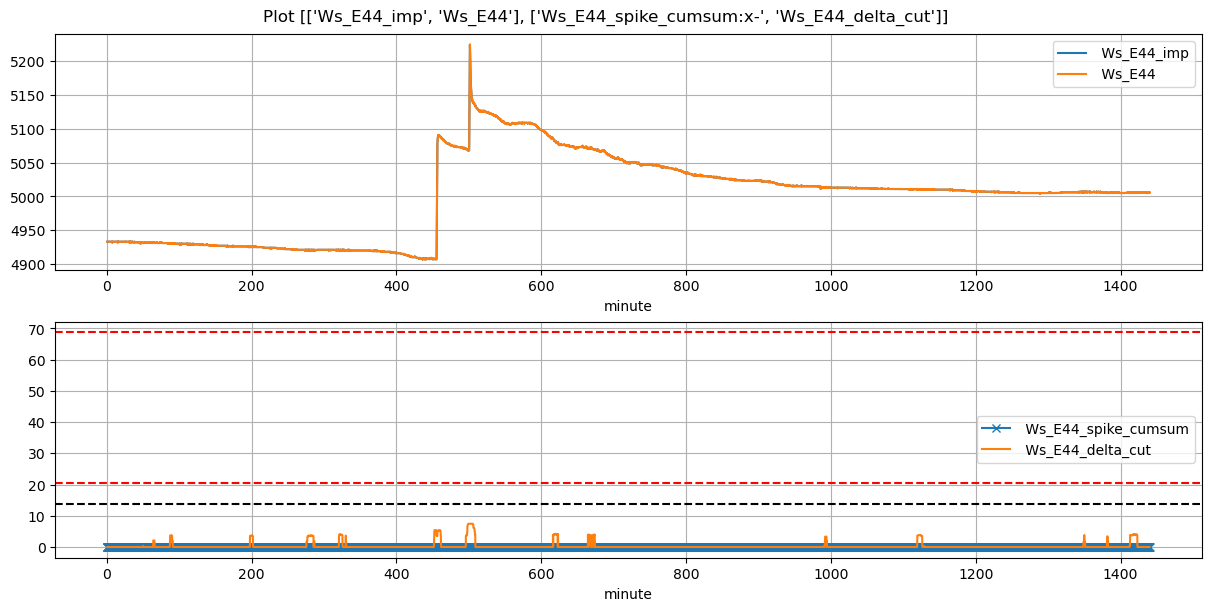
| 2026-04-03 07:35:00+08:00 | 179 | 455 | Ws_E44 | 0.521686 | 30 | 455.0 | 455.333333 | 456.0 | 458.083333 | 4907.0 | 5091.00 | 60 | -0.003702 | -0.083627 | -0.017233 | 0.403778 | 0.613333 | 36.80 | True | 20.0 | 125.0 | 36.80 | 0.0 | 2.966784 | 2.966784 | 1234 | 135 | -0.091213 | 5076.166081 | NaN | NaN |
| 2026-04-03 08:20:00+08:00 | 179 | 500 | Ws_E44 | 0.521686 | 30 | 500.0 | 500.250000 | 501.0 | 501.500000 | 5069.0 | 5218.25 | 60 | -0.027329 | -0.244748 | -0.039033 | 0.449444 | 0.497500 | 29.85 | True | 15.0 | 30.0 | 35.04 | 5.2 | 17.142607 | 22.342607 | 649 | 34 | -0.436201 | 5132.536964 | NaN | NaN |