| 2026-04-14 08:10:00+08:00 |
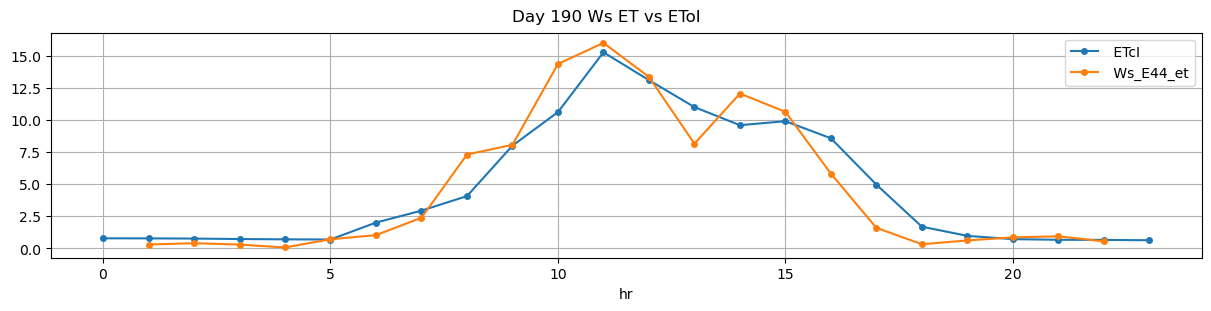
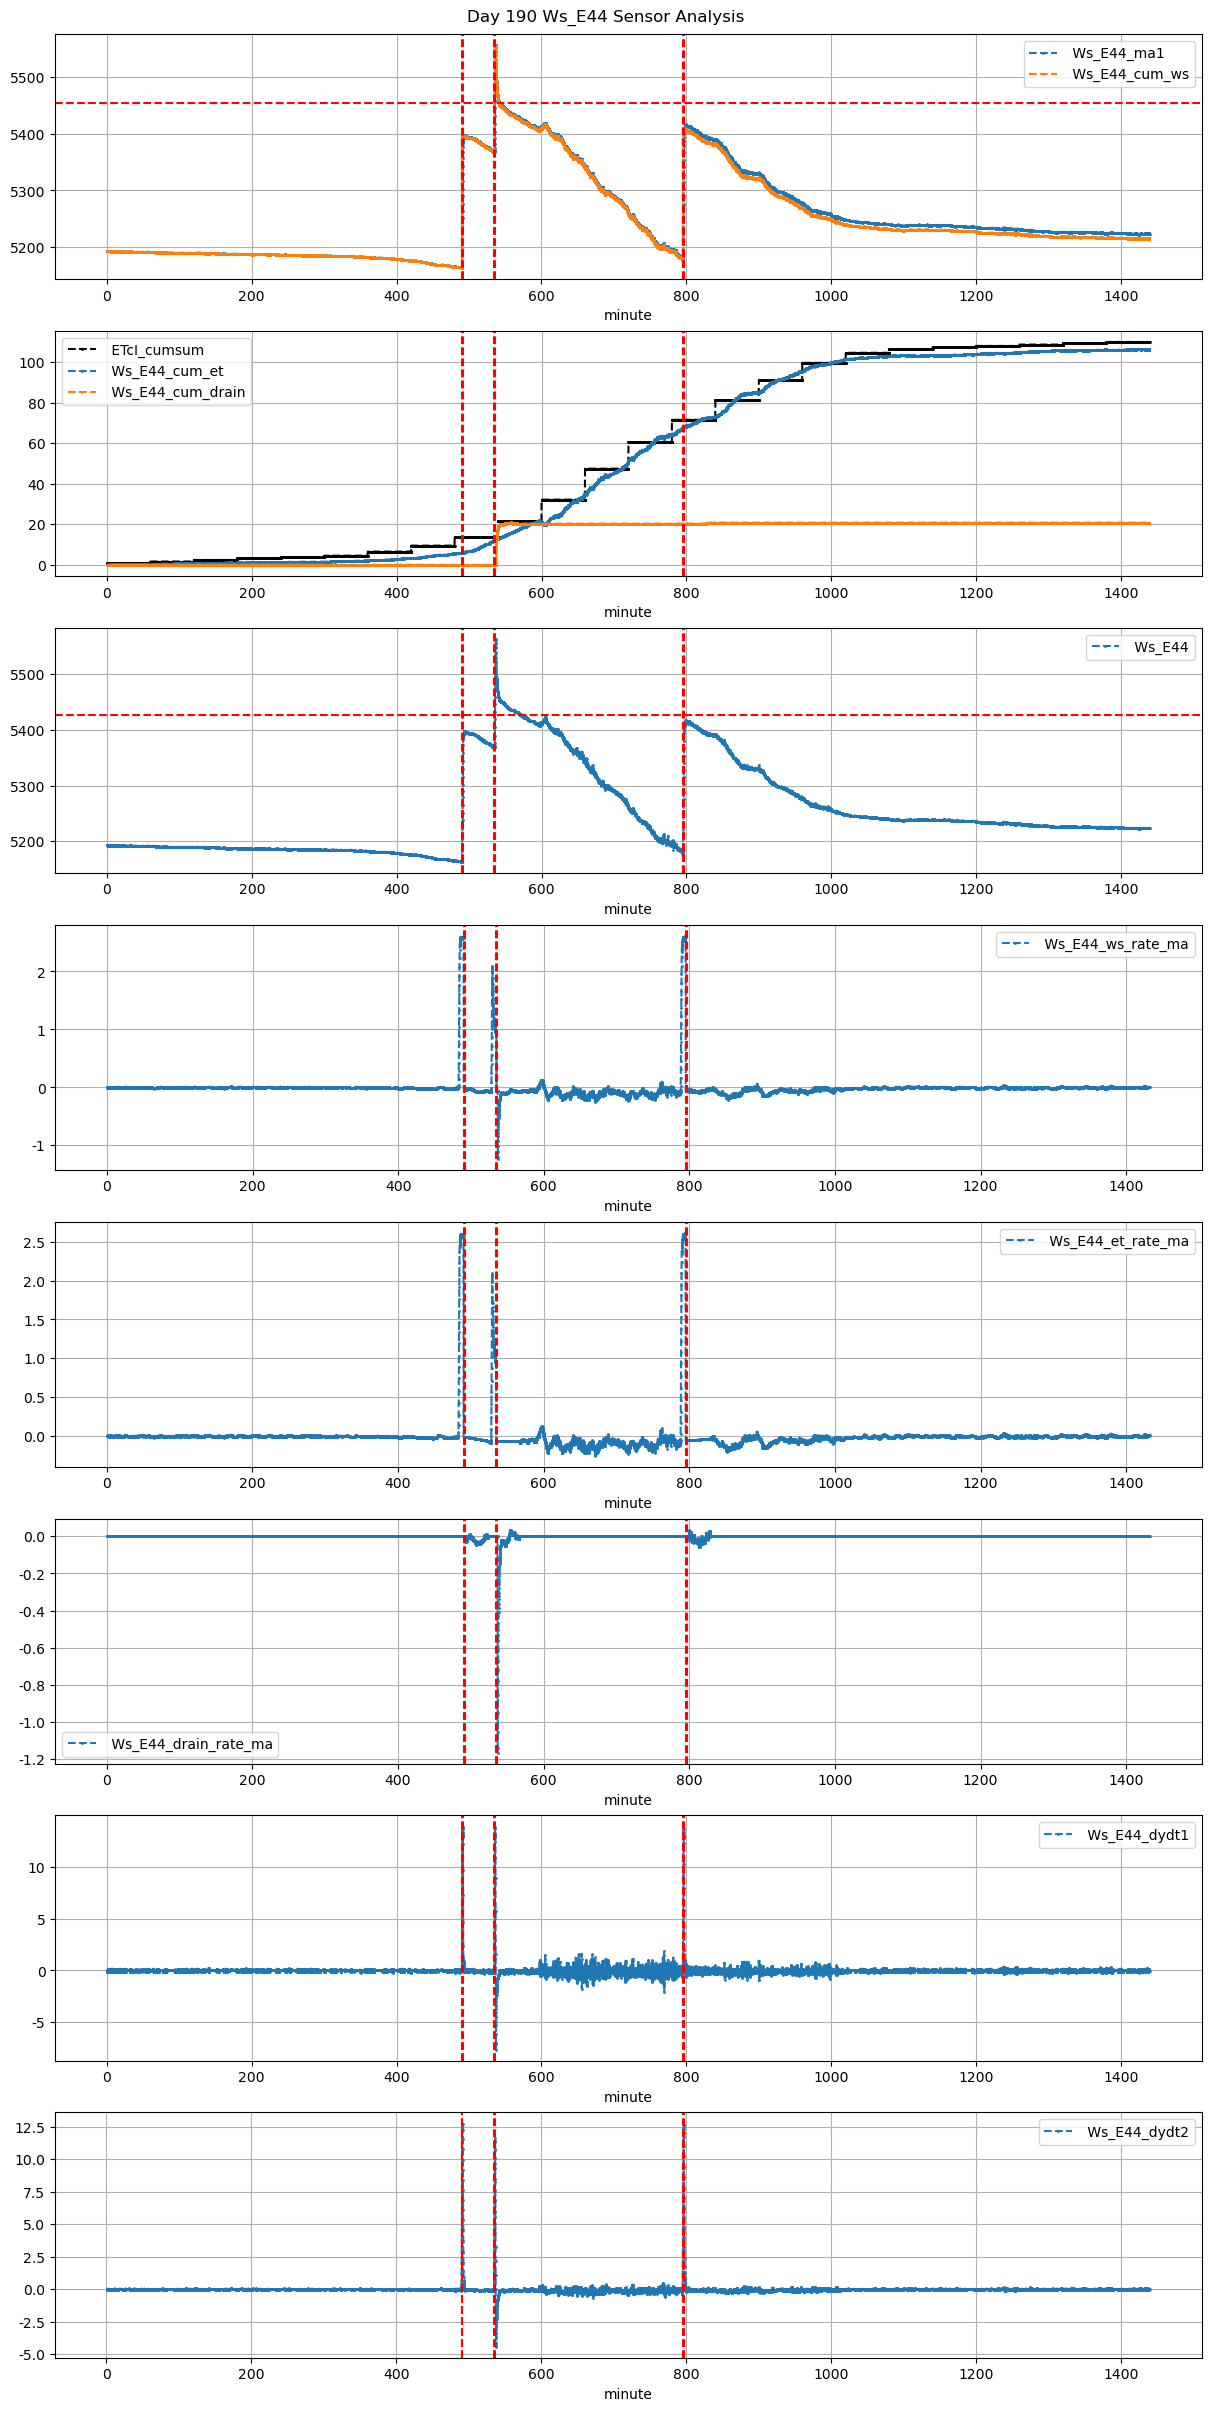
190 |
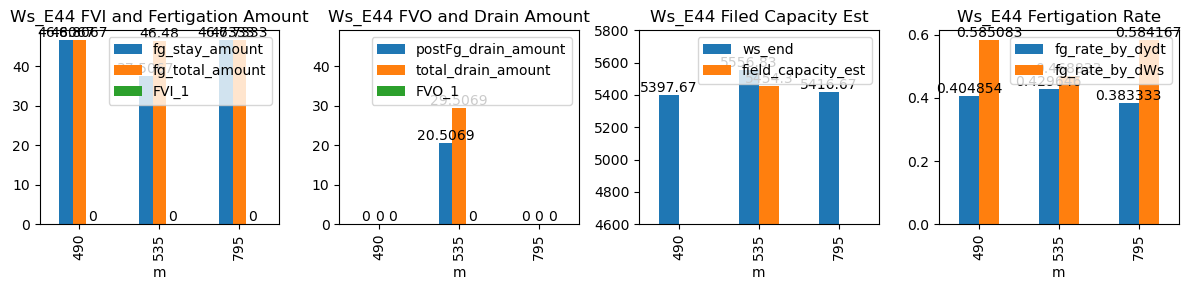
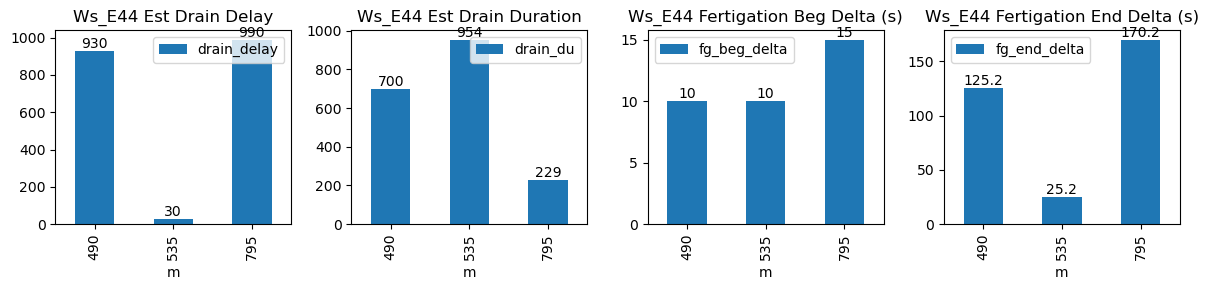
490 |
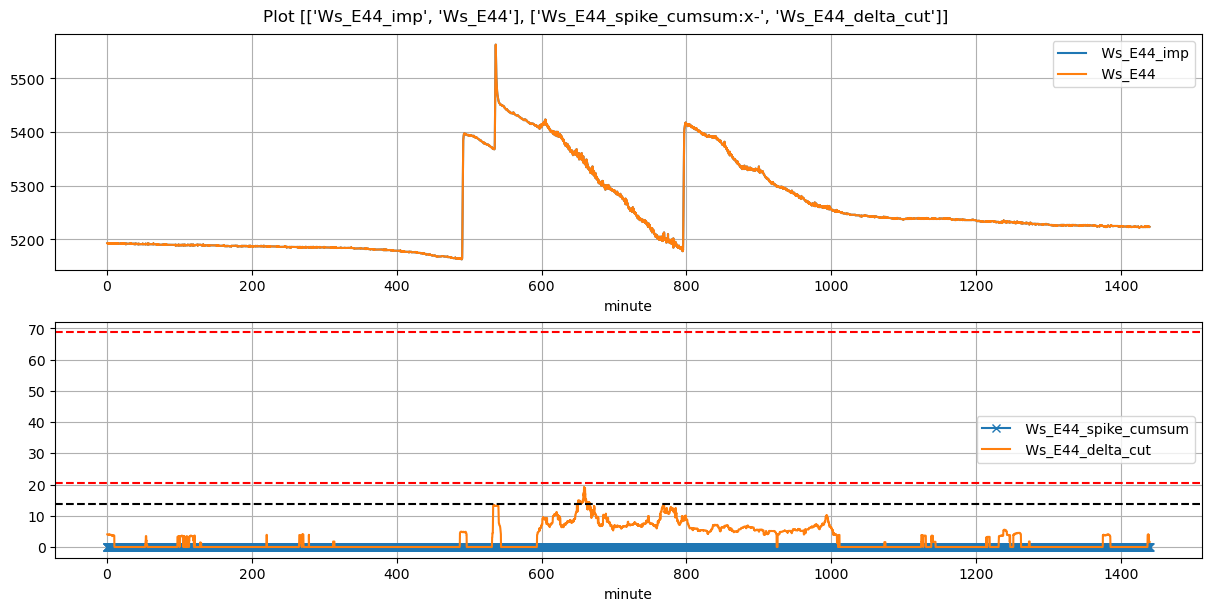
Ws_E44 |
0.65278 |
30 |
490.0 |
490.166667 |
491.33 |
493.416667 |
5163.633333 |
5397.666667 |
80 |
-0.014014 |
-0.025456 |
-0.062332 |
0.404854 |
0.585083 |
46.806667 |
True |
10.0 |
125.2 |
46.806667 |
0.0 |
0.000000 |
0.000000 |
700 |
930 |
-0.041709 |
NaN |
NaN |
NaN |
| 2026-04-14 08:55:00+08:00 |
190 |
535 |
Ws_E44 |
0.65278 |
30 |
535.0 |
535.166667 |
536.33 |
536.750000 |
5369.300000 |
5556.833333 |
80 |
-0.068465 |
-0.276912 |
-0.065628 |
0.429646 |
0.468833 |
37.506667 |
True |
10.0 |
25.2 |
46.480000 |
9.0 |
20.506898 |
29.506898 |
954 |
30 |
-0.488744 |
5454.298842 |
NaN |
NaN |
| 2026-04-14 13:15:00+08:00 |
190 |
795 |
Ws_E44 |
0.65278 |
30 |
795.0 |
795.250000 |
796.33 |
799.166667 |
5183.000000 |
5416.666667 |
80 |
-0.095225 |
-0.058045 |
-0.035057 |
0.383333 |
0.584167 |
46.733333 |
True |
15.0 |
170.2 |
46.733333 |
0.0 |
0.000000 |
0.000000 |
229 |
990 |
-0.046478 |
NaN |
NaN |
NaN |