| 2026-04-13 07:50:00+08:00 |
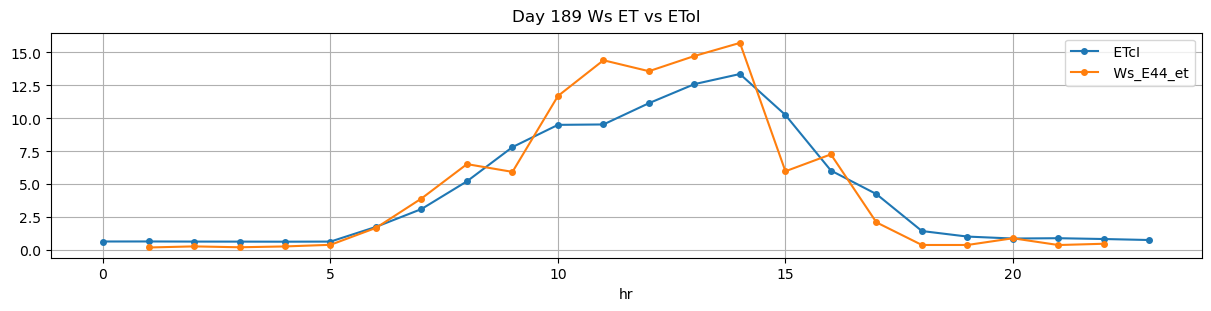
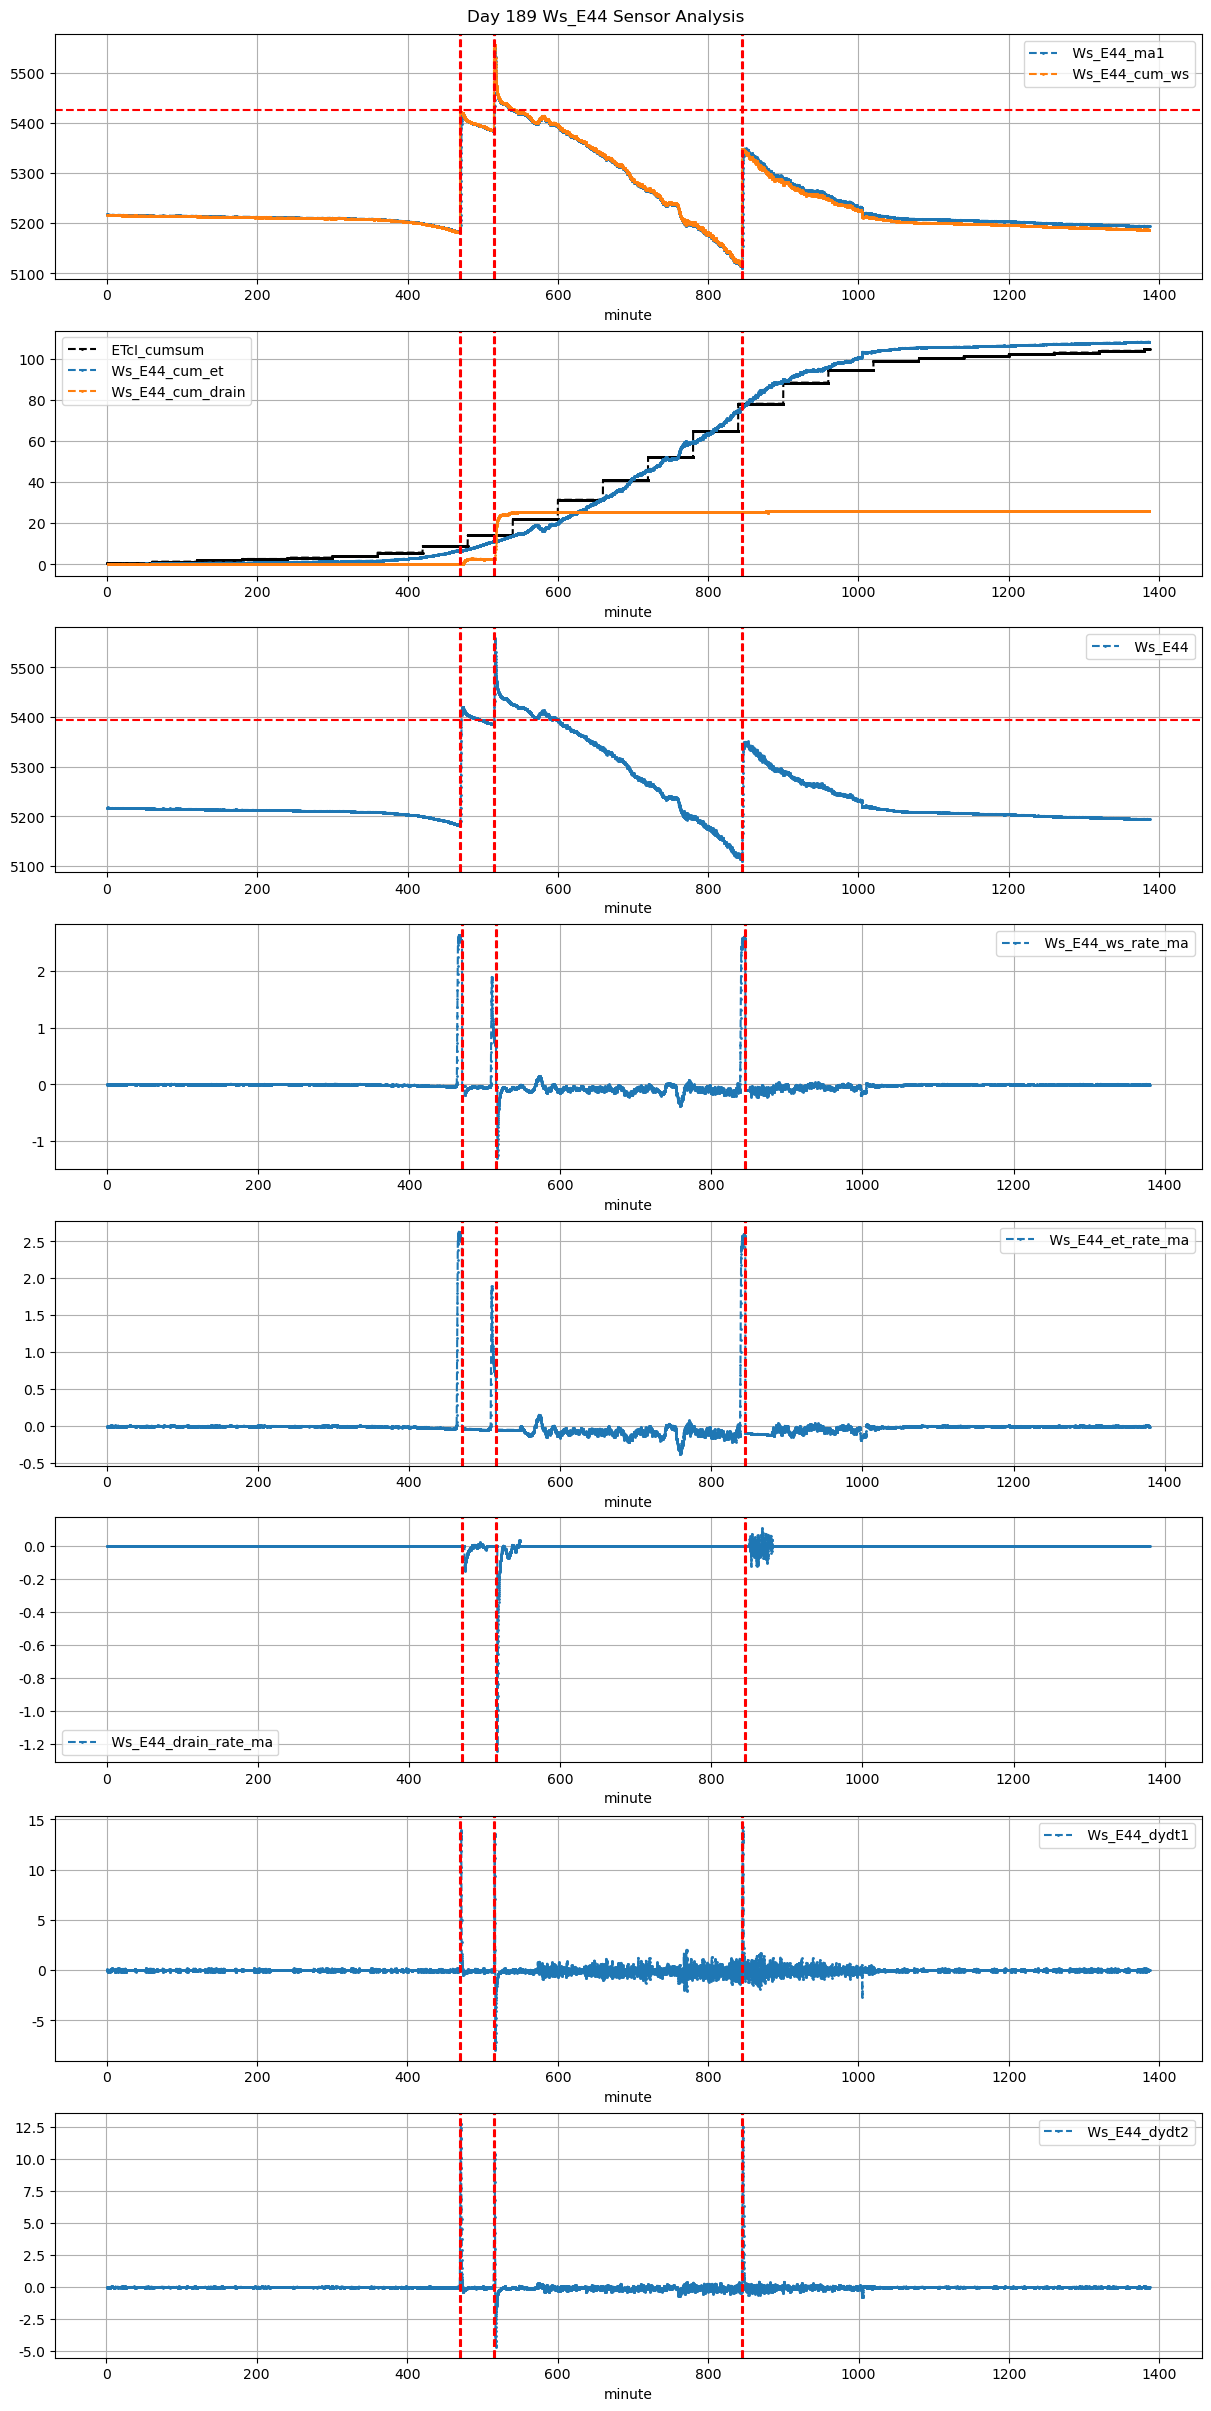
189 |
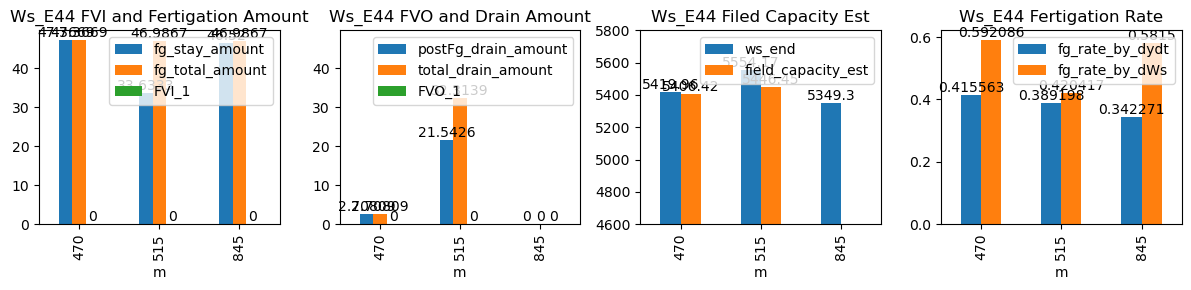
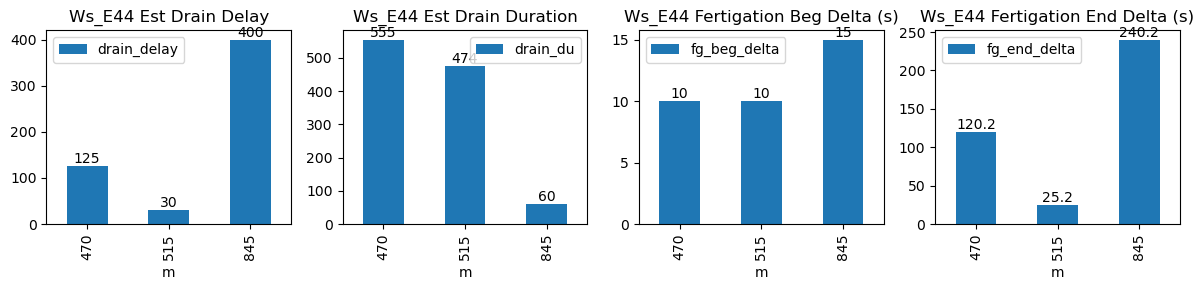
470 |
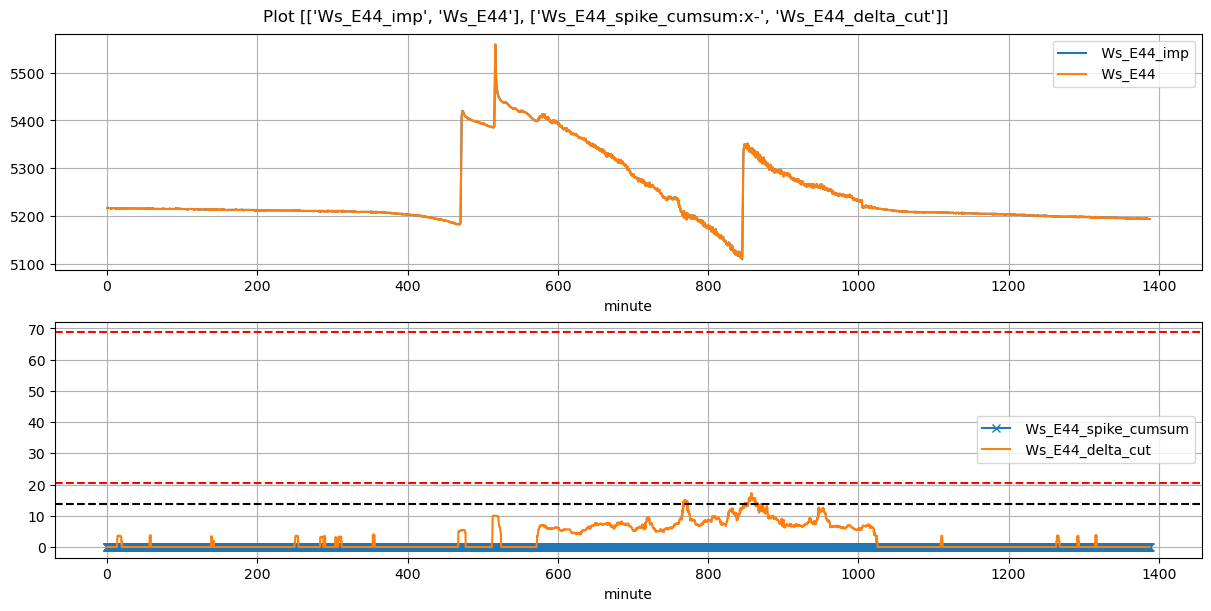
Ws_E44 |
0.743473 |
30 |
470.0 |
470.166667 |
471.33 |
473.333333 |
5183.125714 |
5419.960000 |
80 |
-0.033979 |
-0.096265 |
-0.053776 |
0.415563 |
0.592086 |
47.366857 |
True |
10.0 |
120.2 |
47.366857 |
0.000000 |
2.708087 |
2.708087 |
555 |
125 |
-0.119519 |
5406.419563 |
NaN |
NaN |
| 2026-04-13 08:35:00+08:00 |
189 |
515 |
Ws_E44 |
0.743473 |
30 |
515.0 |
515.166667 |
516.33 |
516.750000 |
5386.000000 |
5554.166667 |
80 |
-0.049152 |
-0.290281 |
-0.053874 |
0.389198 |
0.420417 |
33.633333 |
True |
10.0 |
25.2 |
46.986667 |
10.771301 |
21.542603 |
32.313904 |
474 |
30 |
-0.431198 |
5446.453654 |
NaN |
NaN |
| 2026-04-13 14:05:00+08:00 |
189 |
845 |
Ws_E44 |
0.743473 |
30 |
845.0 |
845.250000 |
846.33 |
850.333333 |
5116.700000 |
5349.300000 |
80 |
-0.100458 |
-0.103611 |
-0.119712 |
0.342271 |
0.581500 |
46.520000 |
True |
15.0 |
240.2 |
46.986667 |
0.000000 |
0.000000 |
0.000000 |
60 |
400 |
-0.092893 |
NaN |
NaN |
NaN |