| 2026-04-12 09:20:00+08:00 |
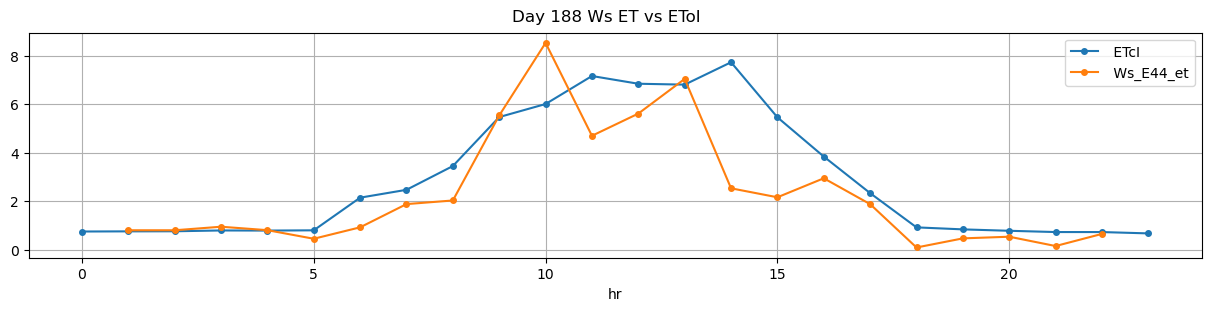
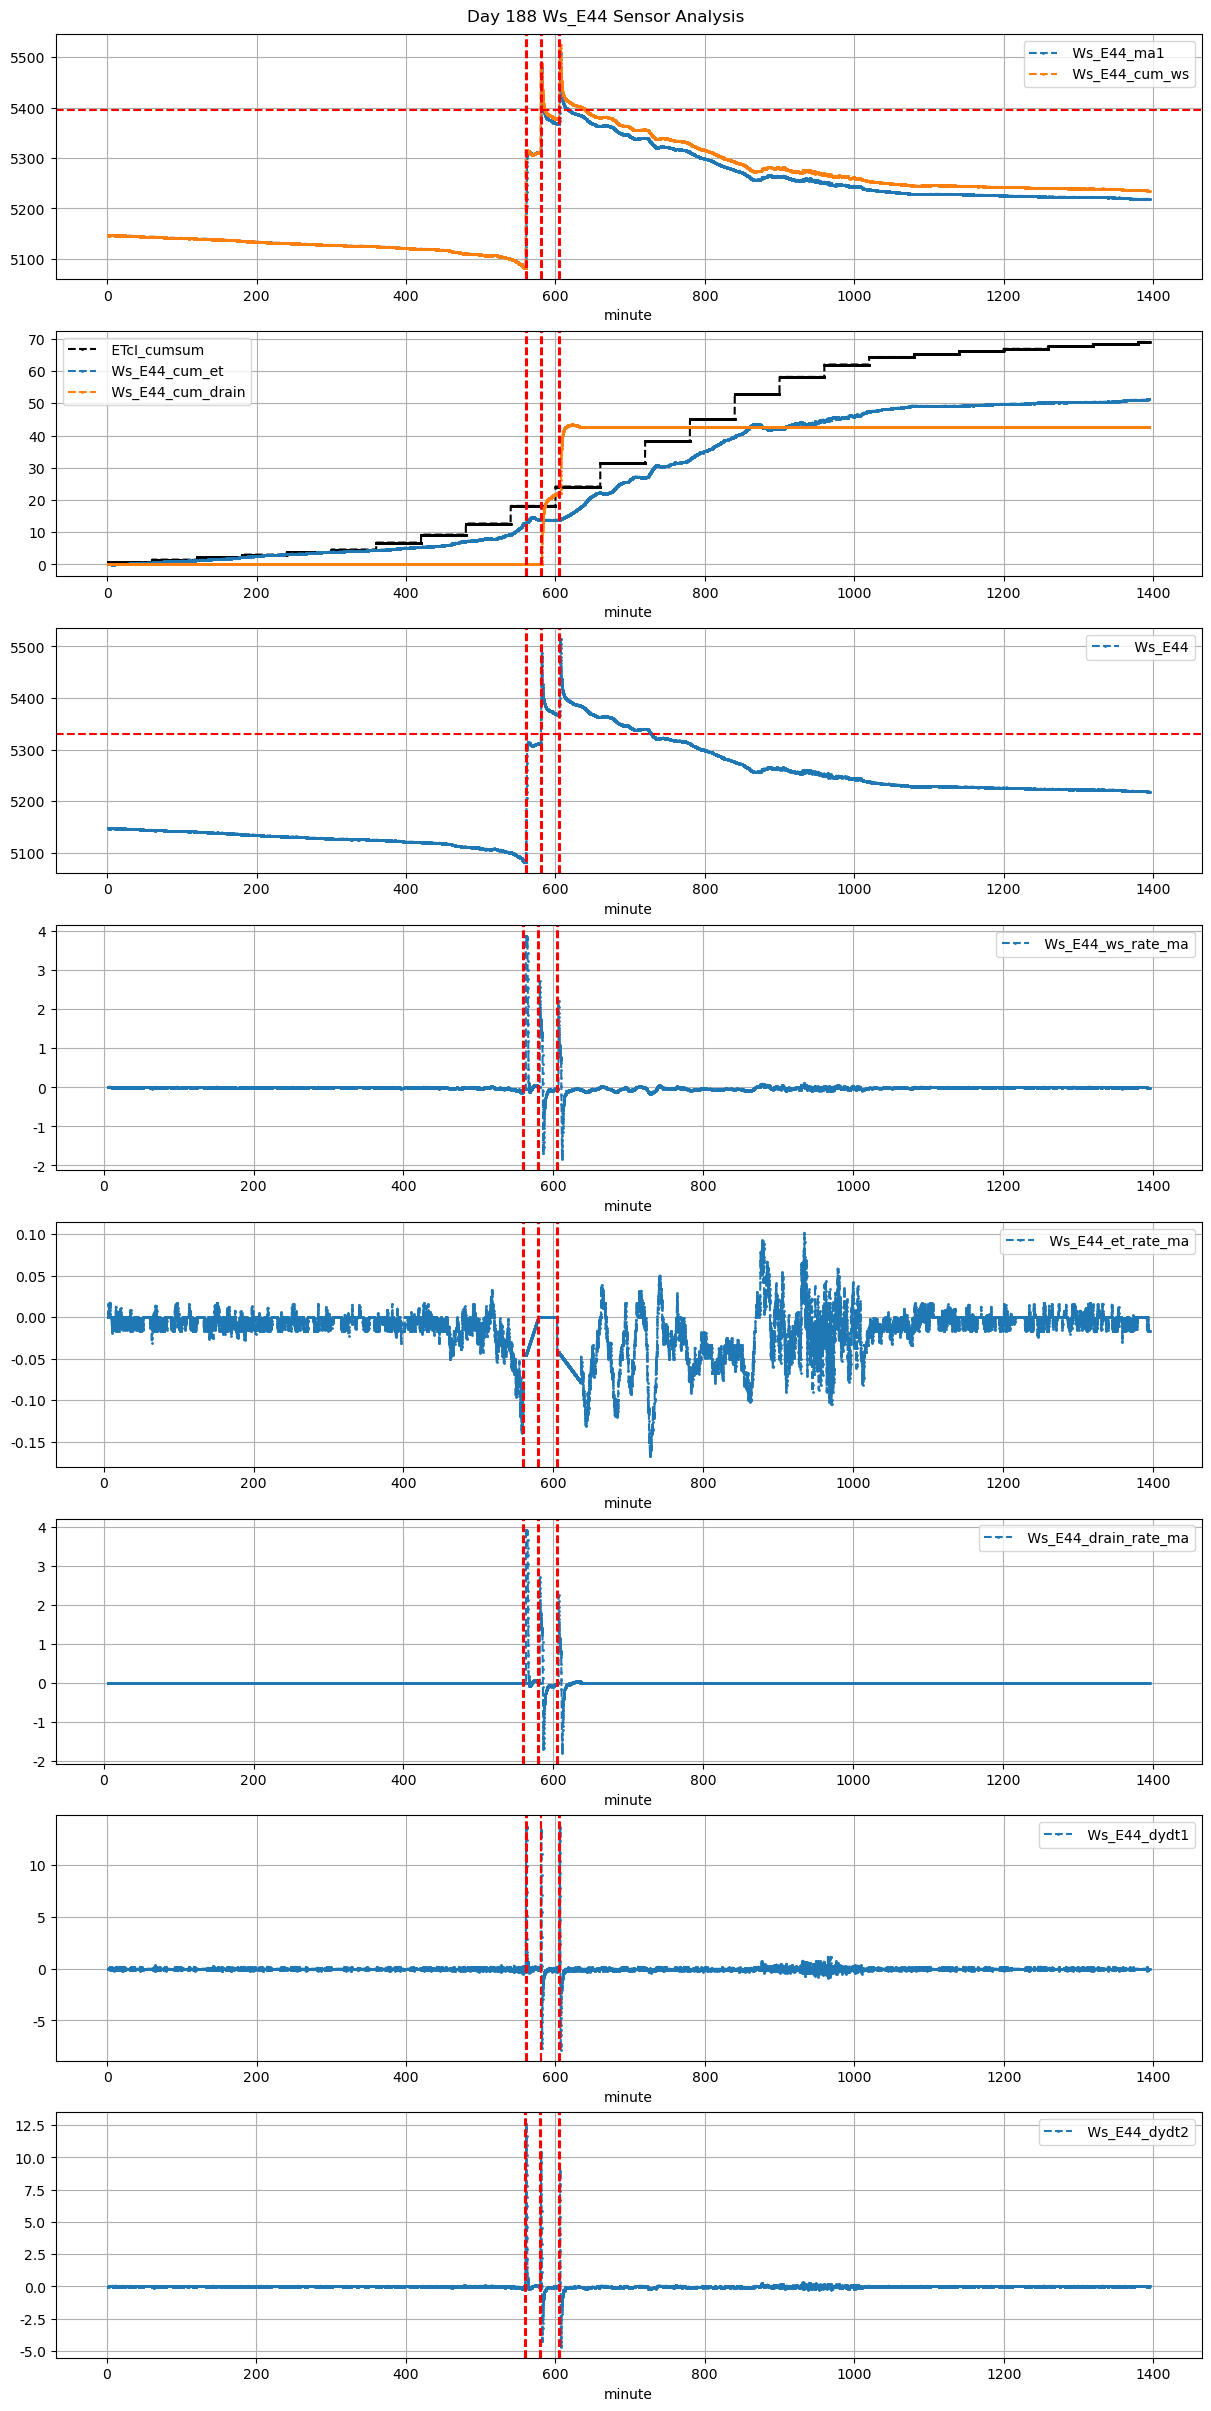
188 |
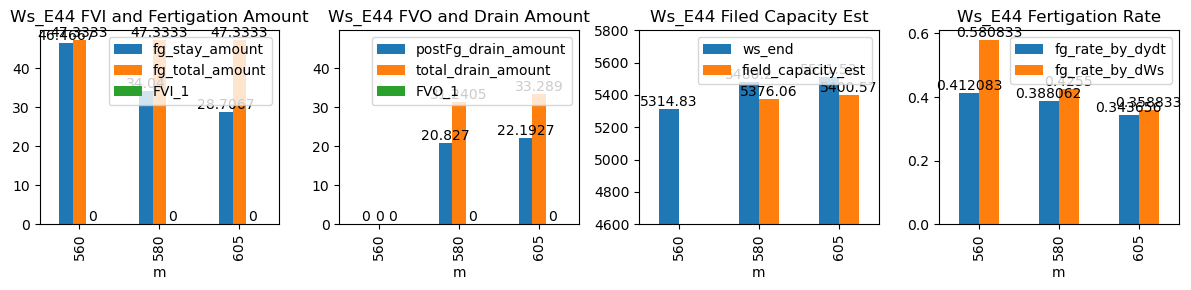
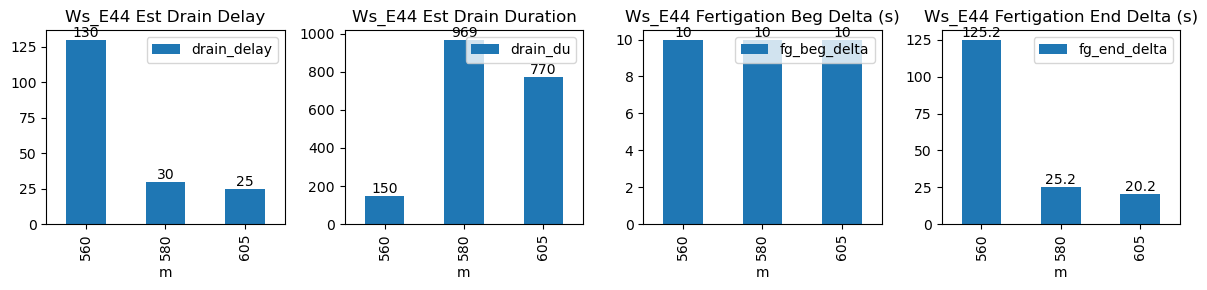
560 |
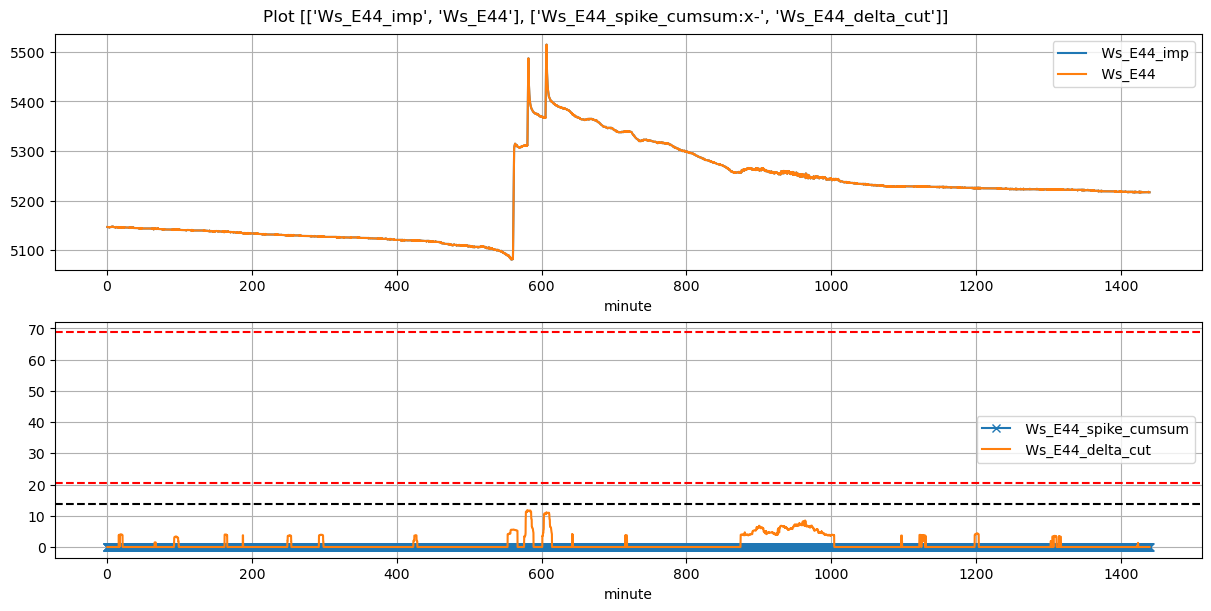
Ws_E44 |
0.85745 |
16.666667 |
560.0 |
560.166667 |
561.33 |
563.333333 |
5082.255556 |
5315.000000 |
80 |
-0.110562 |
-0.045324 |
0.000000 |
0.415625 |
0.581861 |
46.548889 |
True |
10.0 |
120.2 |
47.333333 |
0.000000 |
0.000000 |
0.000000 |
15 |
195 |
-0.332534 |
NaN |
NaN |
NaN |
| 2026-04-12 09:40:00+08:00 |
188 |
580 |
Ws_E44 |
0.85745 |
23.166667 |
580.0 |
580.166667 |
581.33 |
581.833333 |
5311.000000 |
5487.000000 |
80 |
0.000000 |
-0.476782 |
0.000000 |
0.384687 |
0.440000 |
35.200000 |
True |
10.0 |
30.2 |
47.333333 |
10.988000 |
21.976000 |
32.964000 |
480 |
40 |
-6.804167 |
5377.120000 |
NaN |
NaN |
| 2026-04-12 10:05:00+08:00 |
188 |
605 |
Ws_E44 |
0.85745 |
30.000000 |
605.0 |
605.166667 |
606.33 |
606.833333 |
5367.960000 |
5514.666667 |
80 |
-0.042274 |
-0.500060 |
-0.078617 |
0.342552 |
0.366767 |
29.341333 |
True |
10.0 |
30.2 |
47.333333 |
10.189647 |
20.379294 |
30.568941 |
369 |
40 |
-7.097311 |
5412.770196 |
NaN |
NaN |