| 2026-04-11 07:41:49+08:00 |
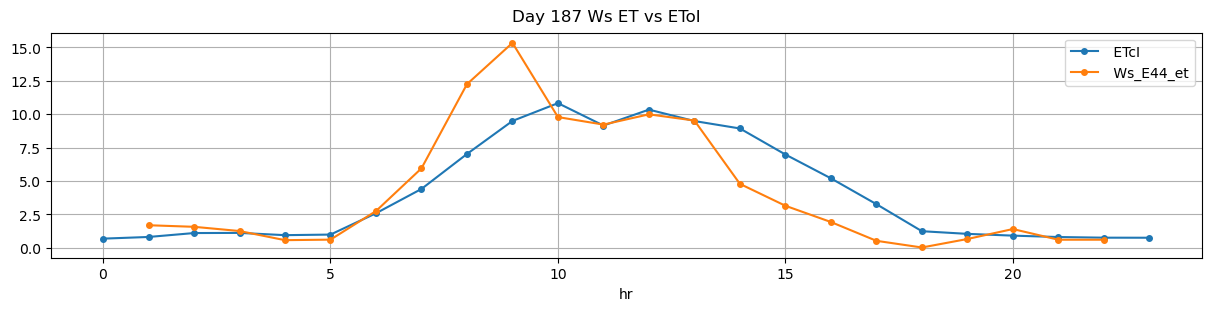
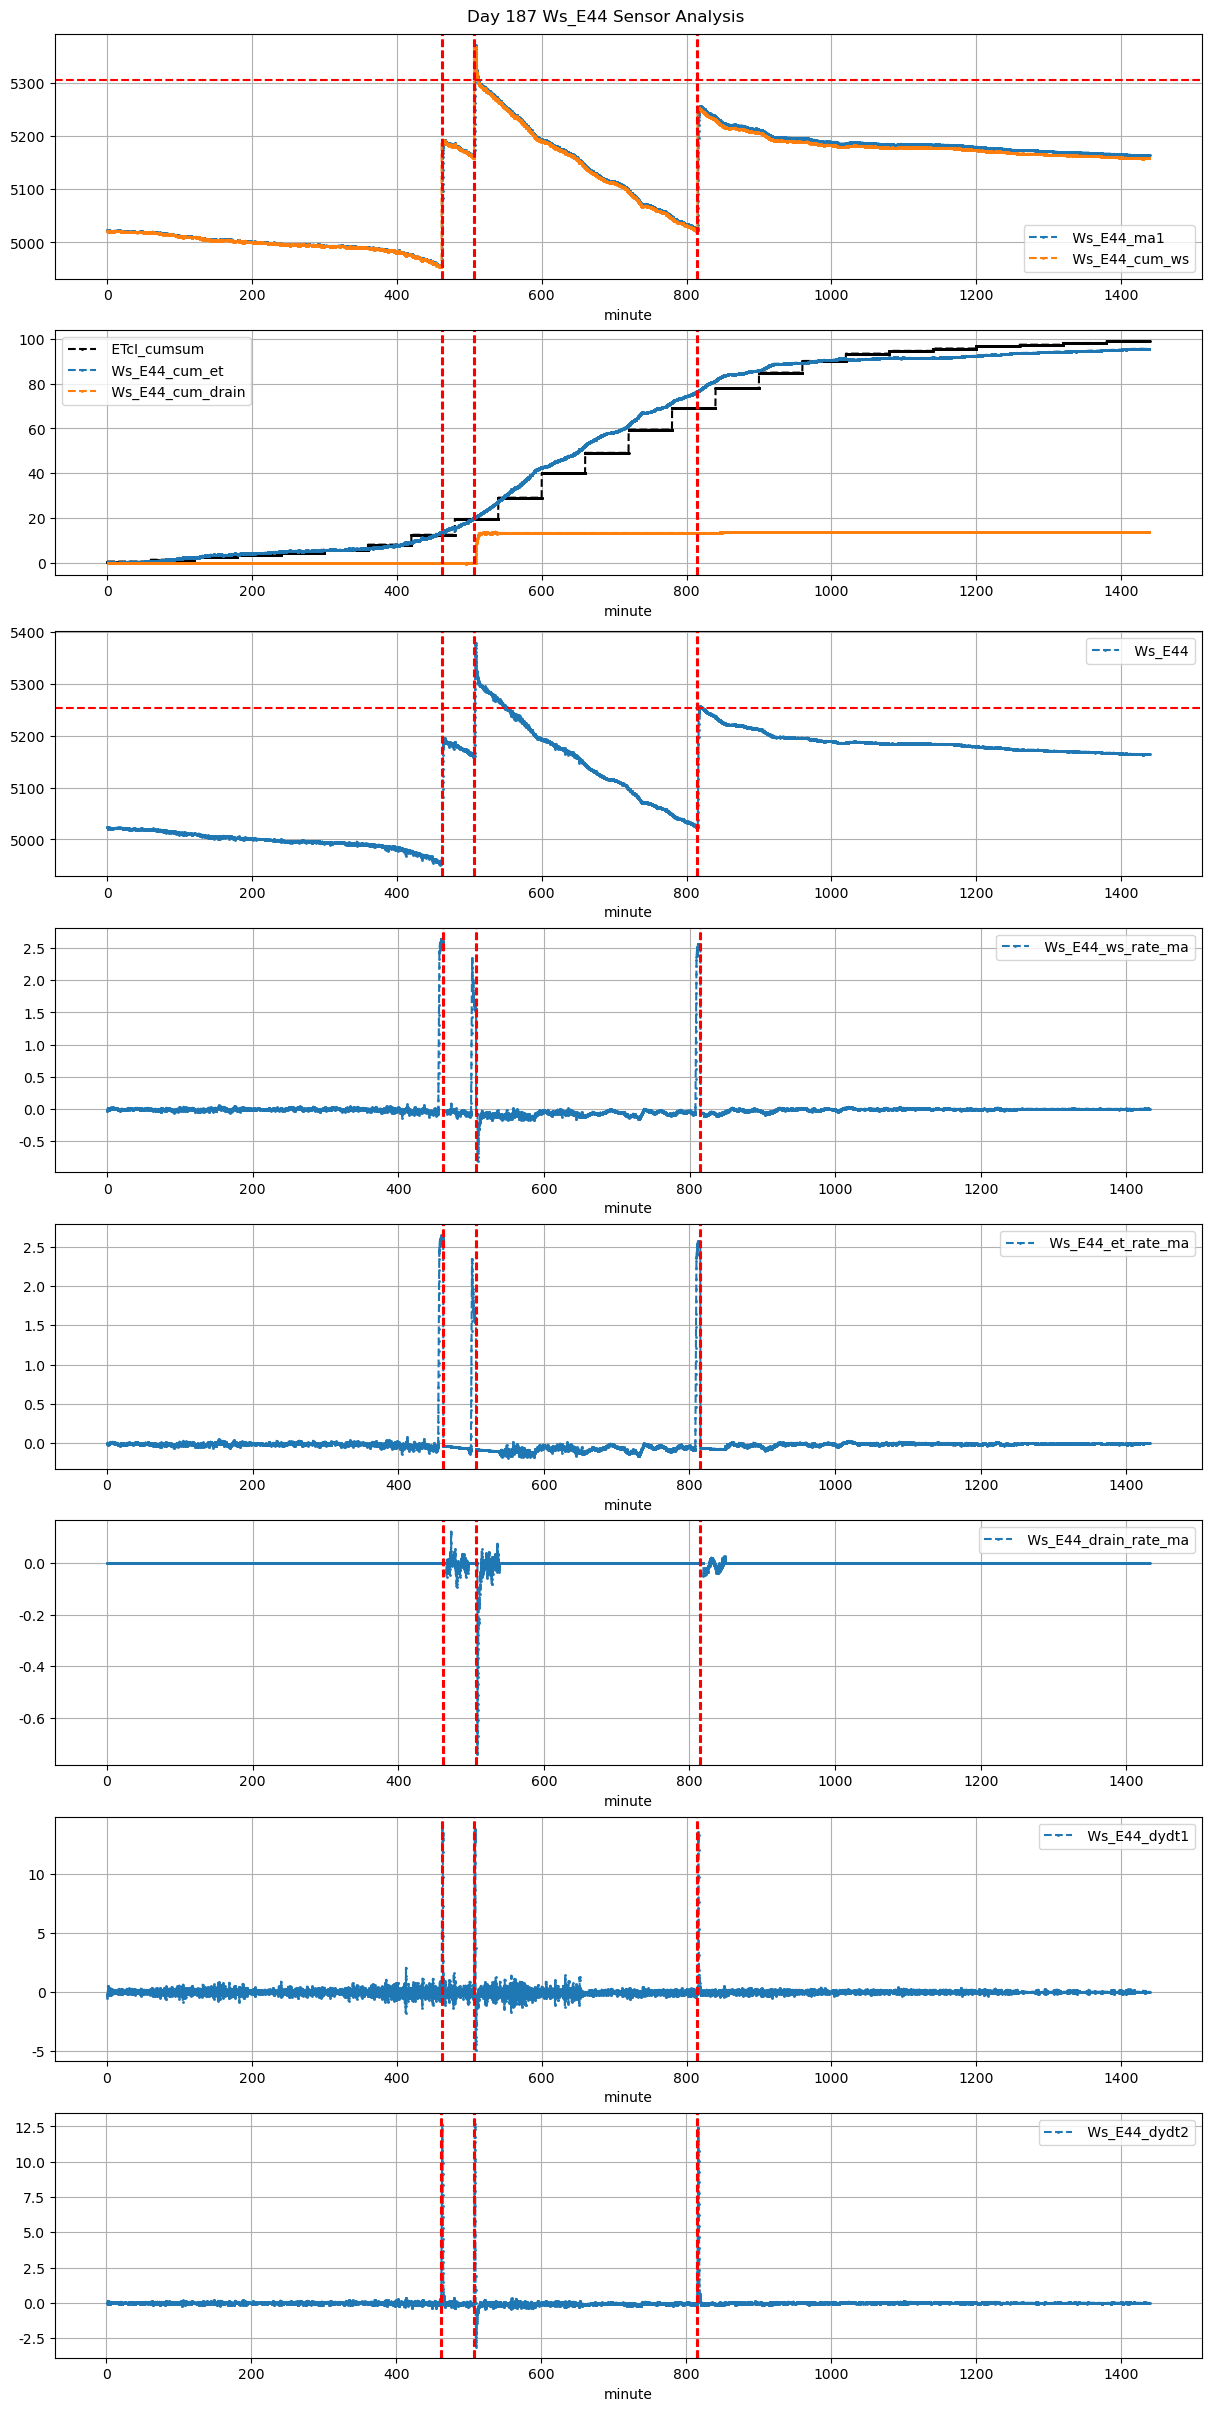
187 |
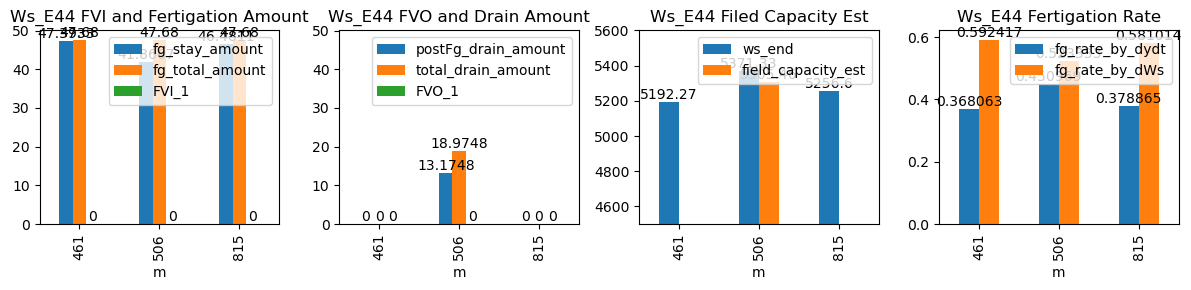
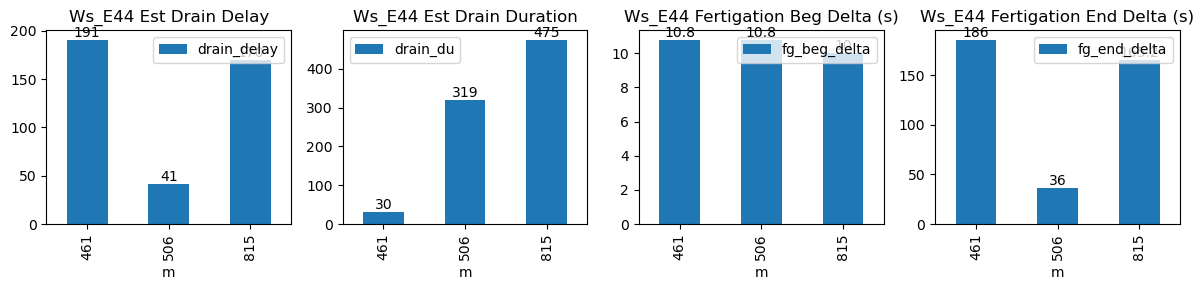
461 |
Ws_E44 |
0.457427 |
30 |
461.82 |
462.000000 |
463.15 |
466.250000 |
4955.300000 |
5192.266667 |
80 |
-0.056770 |
-0.034126 |
-0.066914 |
0.368063 |
0.592417 |
47.393333 |
True |
10.8 |
186.0 |
47.68 |
0.0 |
0.000000 |
0.000000 |
30 |
191 |
-0.053129 |
NaN |
NaN |
NaN |
| 2026-04-11 08:26:49+08:00 |
187 |
506 |
Ws_E44 |
0.457427 |
30 |
506.82 |
507.000000 |
508.15 |
508.750000 |
5162.000000 |
5371.333333 |
80 |
-0.077891 |
-0.225062 |
-0.102418 |
0.450969 |
0.523333 |
41.866667 |
True |
10.8 |
36.0 |
47.68 |
5.8 |
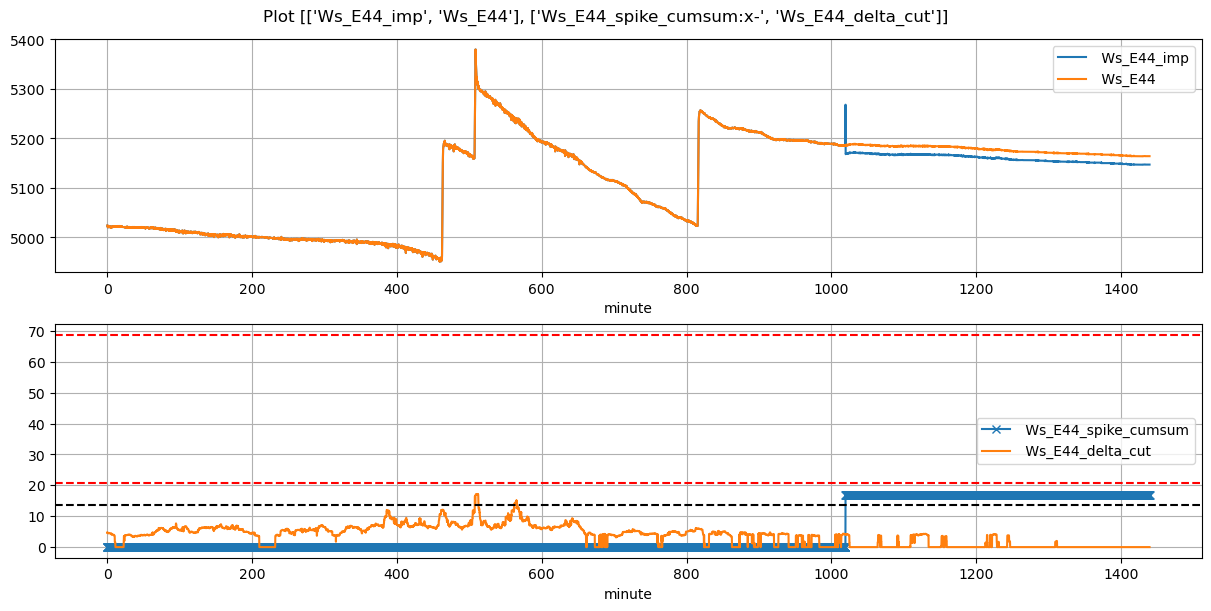
13.174775 |
18.974775 |
319 |
41 |
-0.297540 |
5305.459457 |
NaN |
NaN |
| 2026-04-11 13:35:00+08:00 |
187 |
815 |
Ws_E44 |
0.457427 |
30 |
815.00 |
815.166667 |
816.33 |
819.083333 |
5024.194444 |
5256.600000 |
80 |
-0.062673 |
-0.094723 |
-0.073182 |
0.378865 |
0.581014 |
46.481111 |
True |
10.0 |
165.2 |
47.68 |
0.0 |
0.000000 |
0.000000 |
475 |
170 |
-0.041920 |
NaN |
NaN |
NaN |