| 2025-11-20 08:45:00+08:00 |
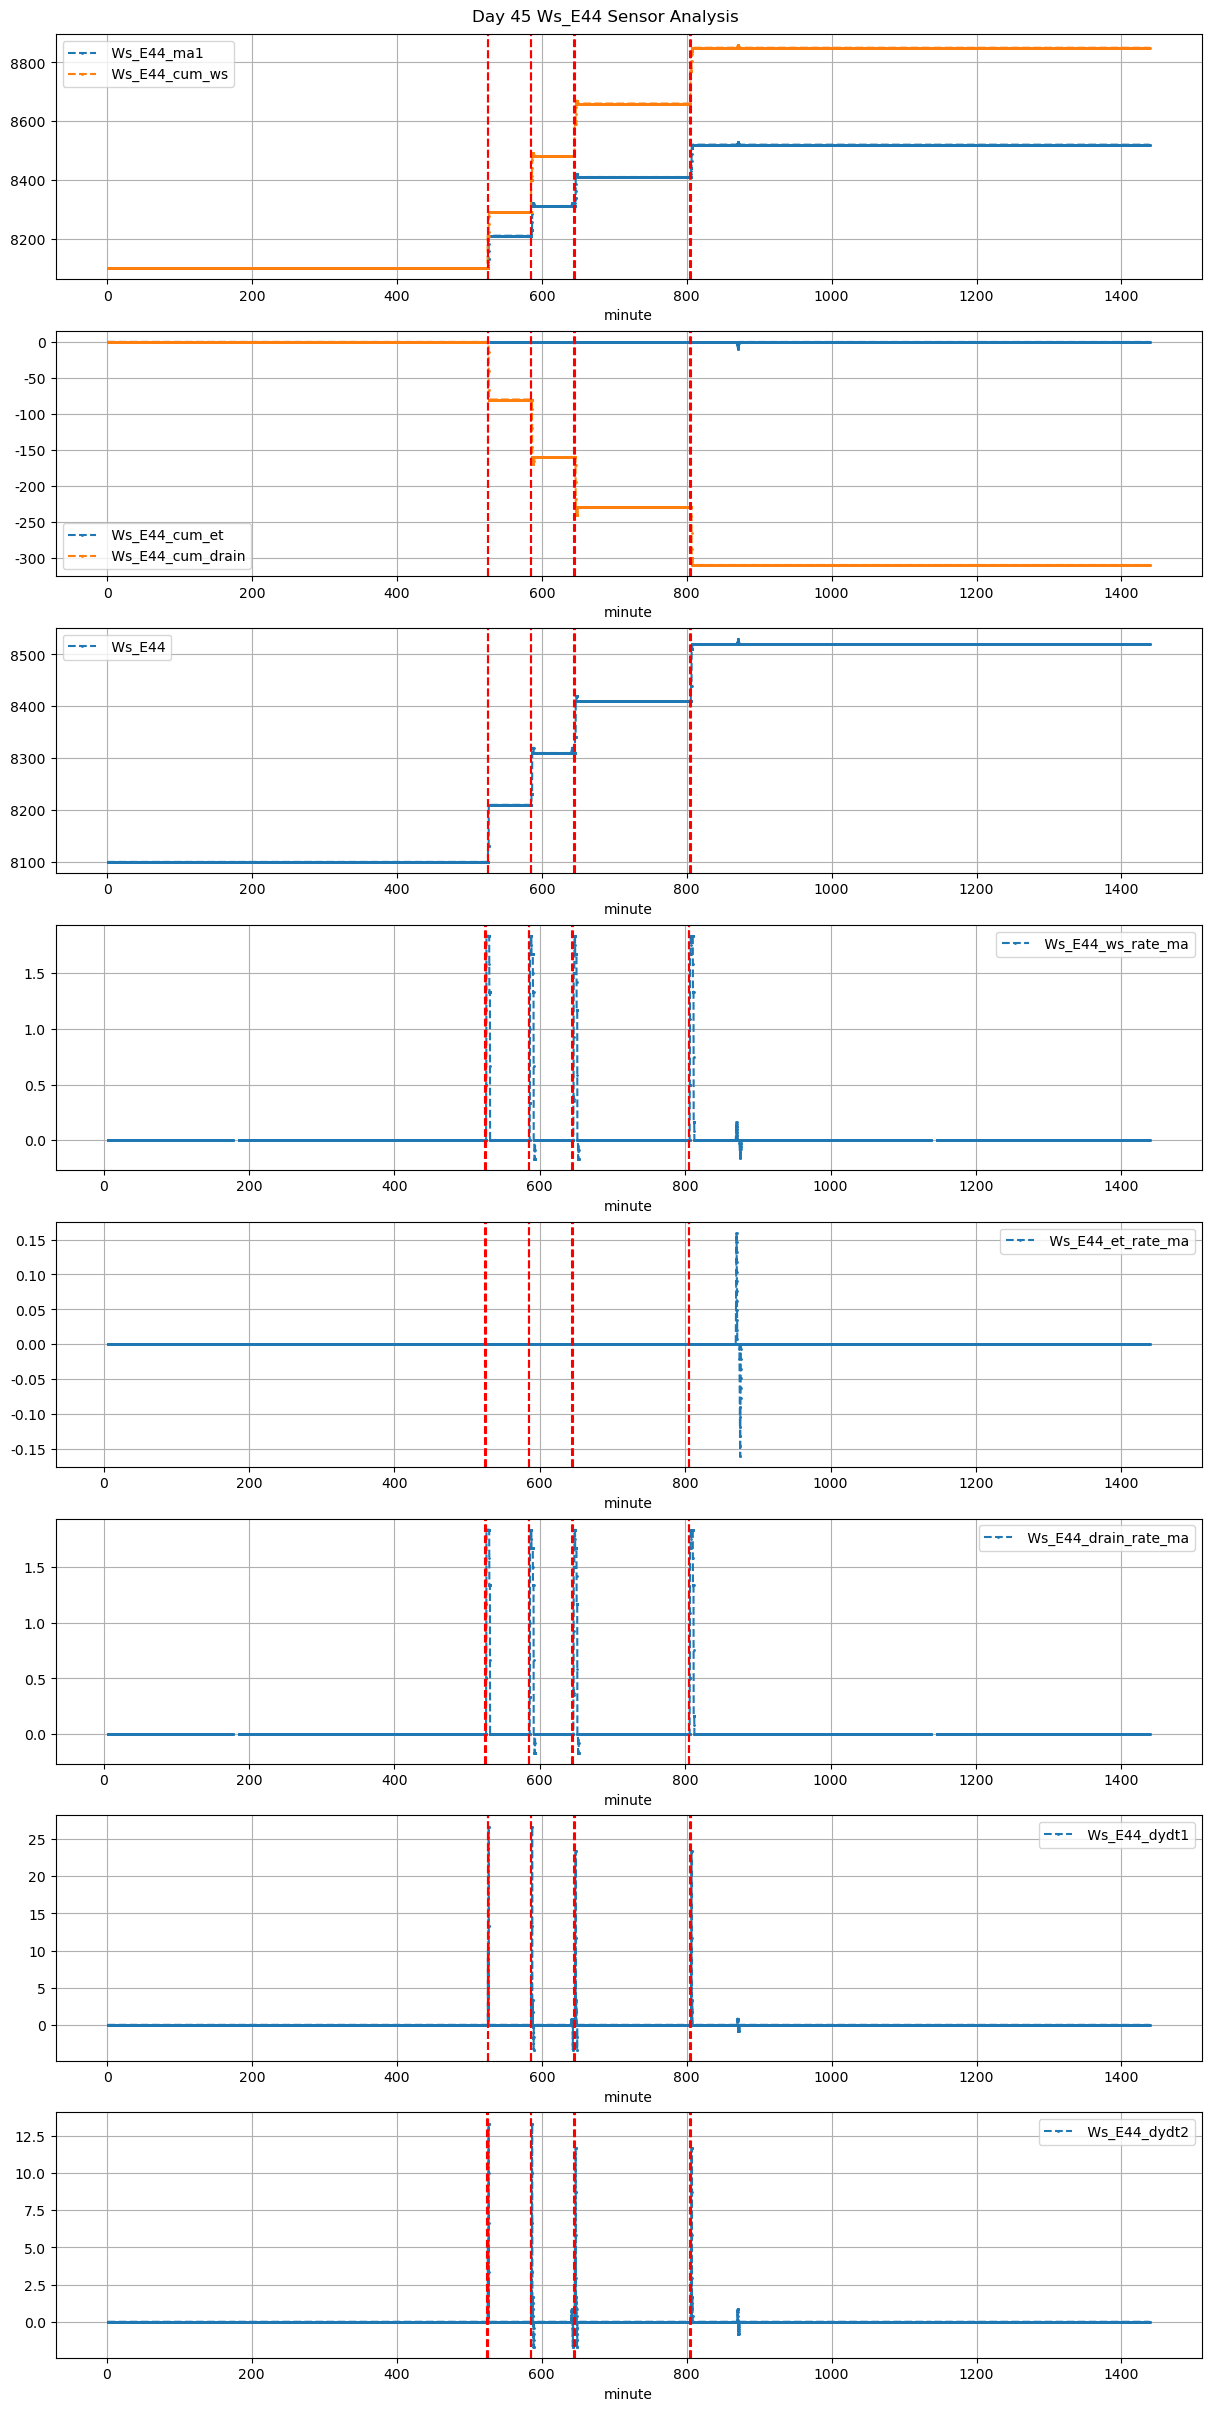
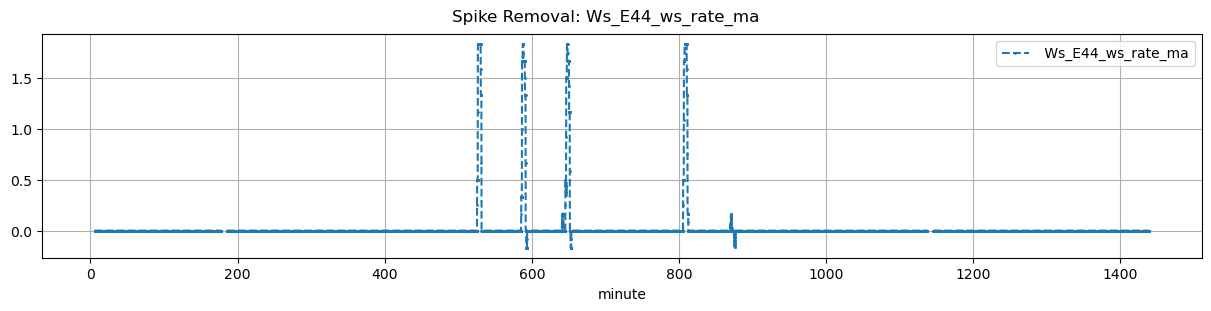
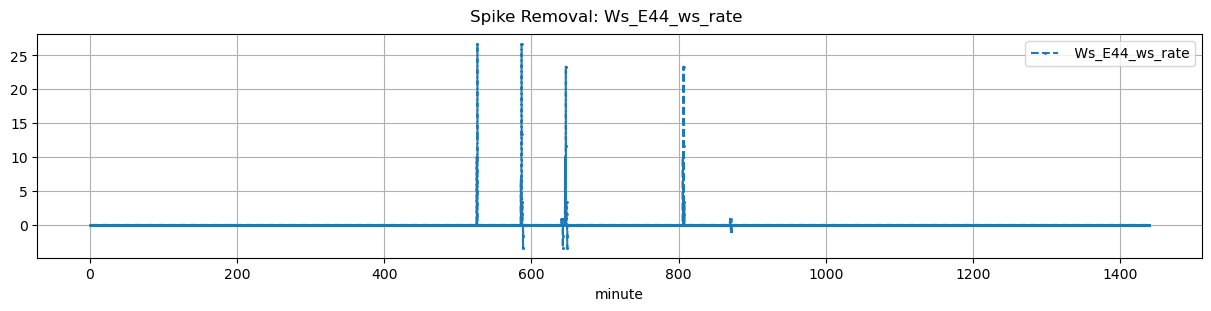
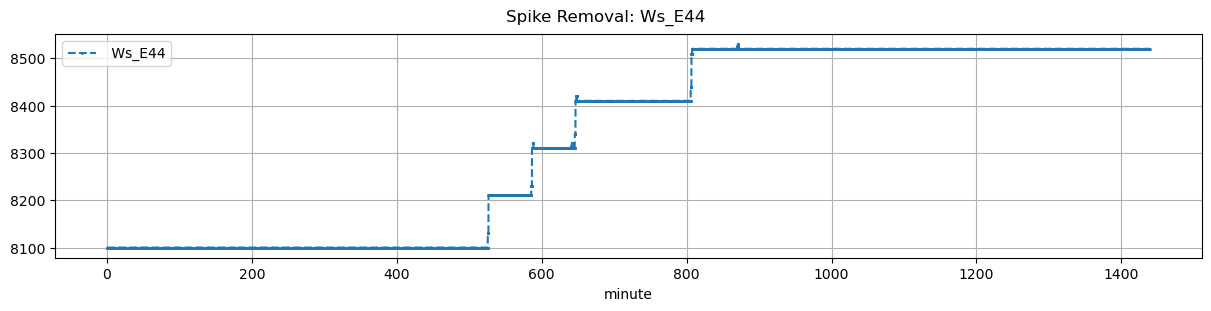
45 |
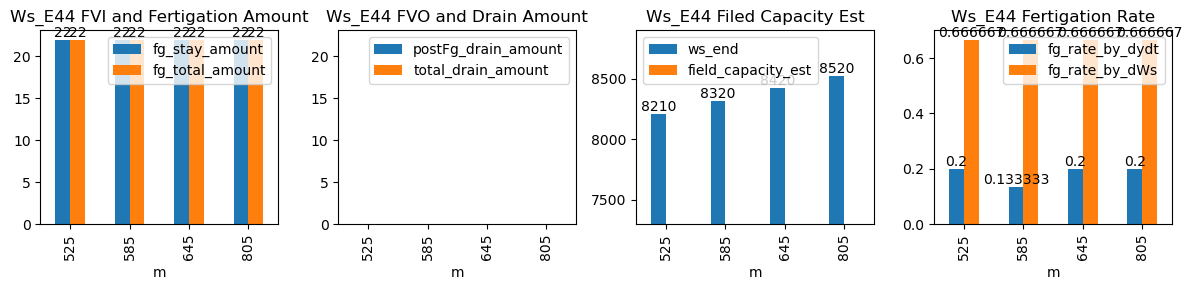
525 |
Ws_E44 |
2.69686 |
30 |
525.0 |
525.333333 |
525.55 |
526.166667 |
NaN |
NaN |
NaN |
8100.0 |
8210.0 |
33 |
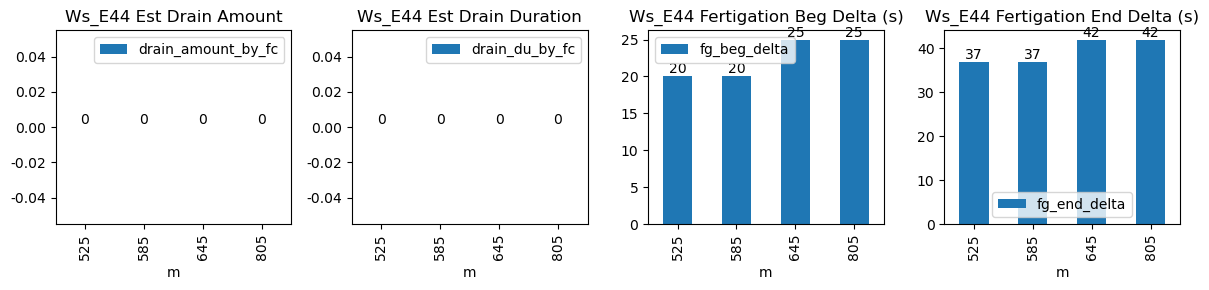
0.0 |
0.0 |
0.0 |
0.200000 |
0.666667 |
22.0 |
20.0 |
37.0 |
22.0 |
0.0 |
-16.0 |
NaN |
-16.0 |
| 2025-11-20 09:45:00+08:00 |
45 |
585 |
Ws_E44 |
2.69686 |
30 |
585.0 |
585.333333 |
585.55 |
586.166667 |
NaN |
NaN |
NaN |
8210.0 |
8320.0 |
33 |
0.0 |
0.0 |
0.0 |
0.133333 |
0.666667 |
22.0 |
20.0 |
37.0 |
22.0 |
0.0 |
-16.0 |
NaN |
-16.0 |
| 2025-11-20 10:45:00+08:00 |
45 |
645 |
Ws_E44 |
2.69686 |
30 |
645.0 |
645.416667 |
645.55 |
646.250000 |
NaN |
NaN |
NaN |
8310.0 |
8420.0 |
33 |
0.0 |
0.0 |
0.0 |
0.200000 |
0.666667 |
22.0 |
25.0 |
42.0 |
22.0 |
0.0 |
-14.0 |
NaN |
-14.0 |
| 2025-11-20 13:25:00+08:00 |
45 |
805 |
Ws_E44 |
2.69686 |
30 |
805.0 |
805.416667 |
805.55 |
806.250000 |
NaN |
NaN |
NaN |
8410.0 |
8520.0 |
33 |
0.0 |
0.0 |
0.0 |
0.200000 |
0.666667 |
22.0 |
25.0 |
42.0 |
22.0 |
0.0 |
-16.0 |
NaN |
-16.0 |