| 2025-11-21 08:11:07+08:00 |
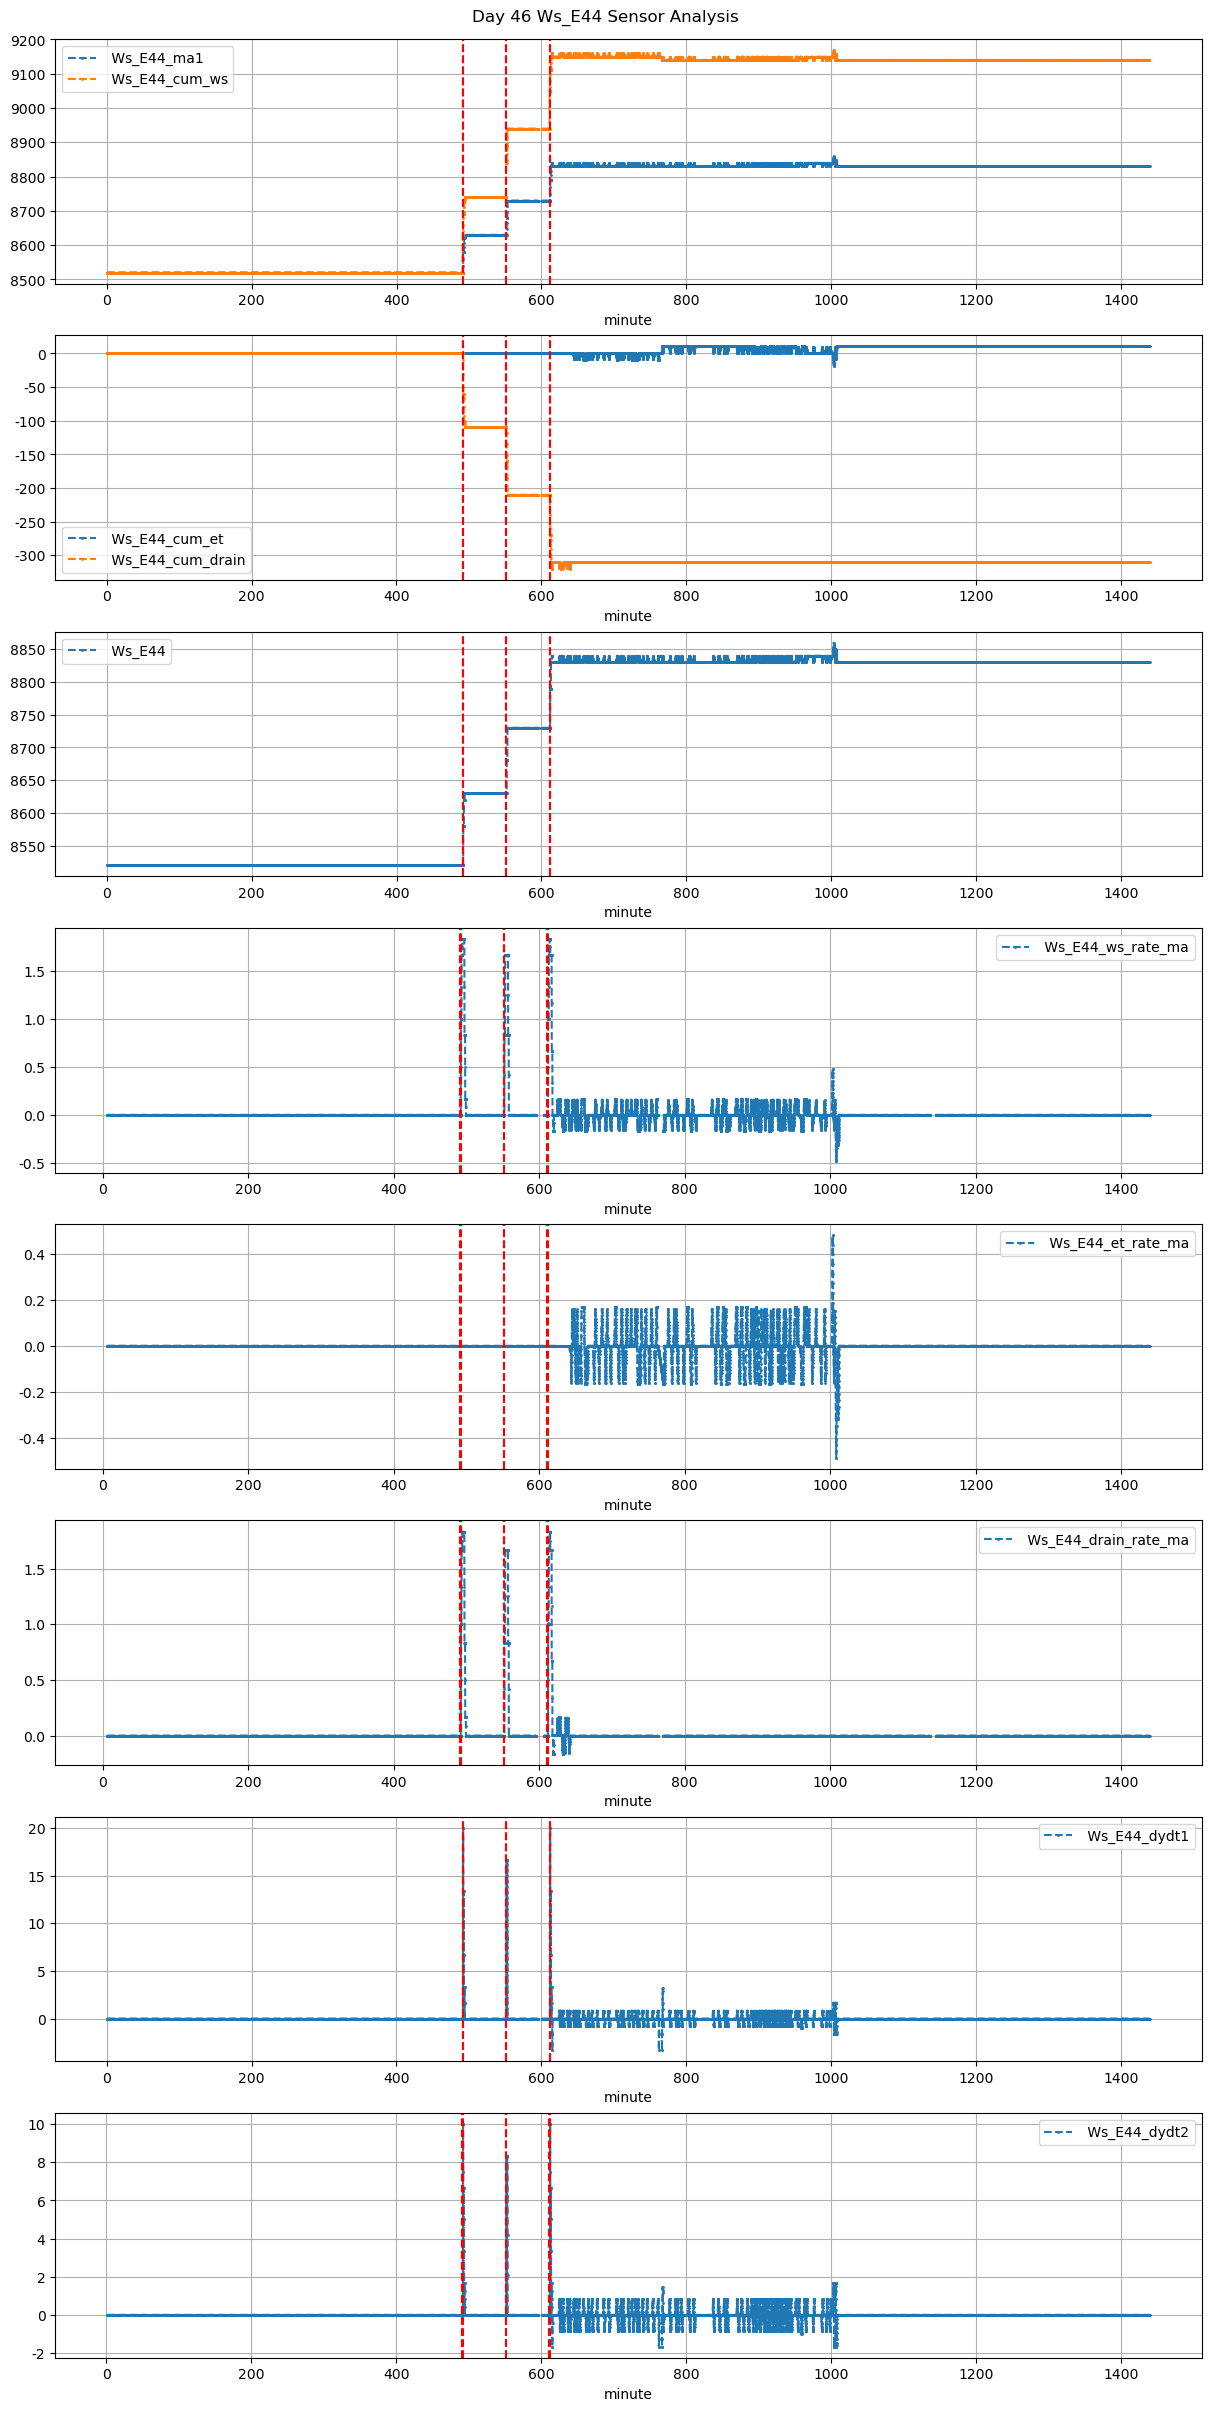
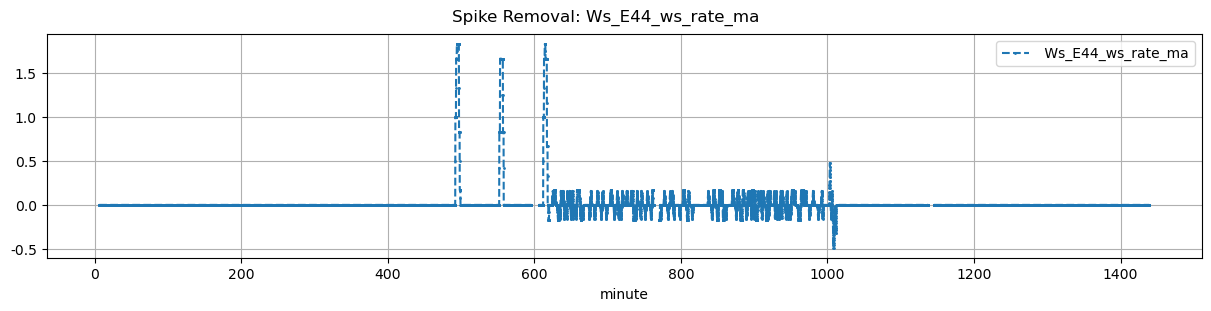
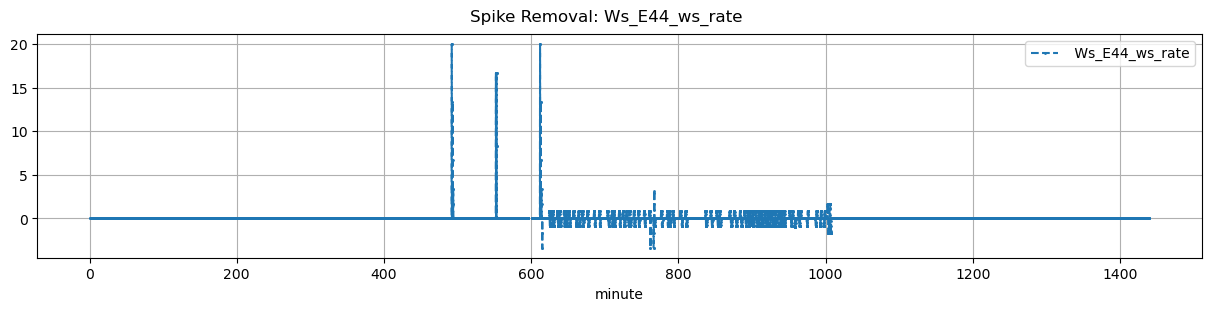
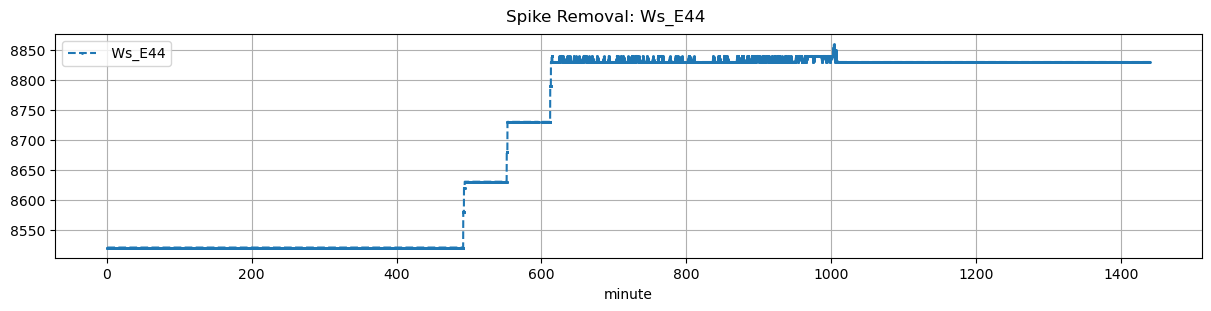
46 |
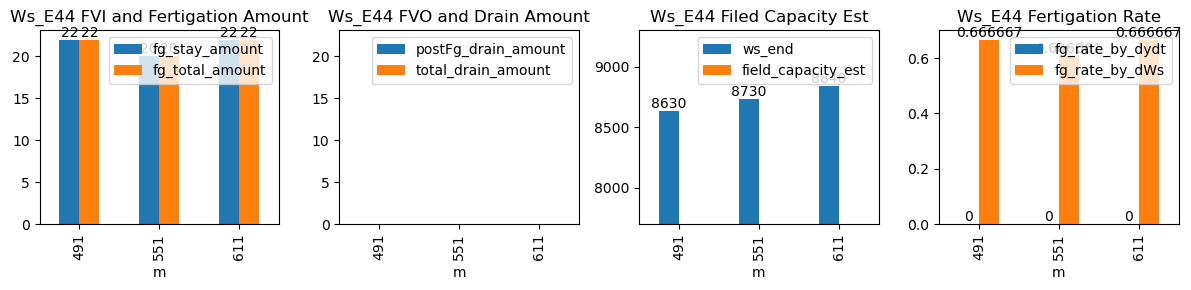
491 |
Ws_E44 |
1.65322 |
30 |
491.12 |
491.666667 |
491.67 |
491.75 |
NaN |
NaN |
NaN |
8520.0 |
8630.0 |
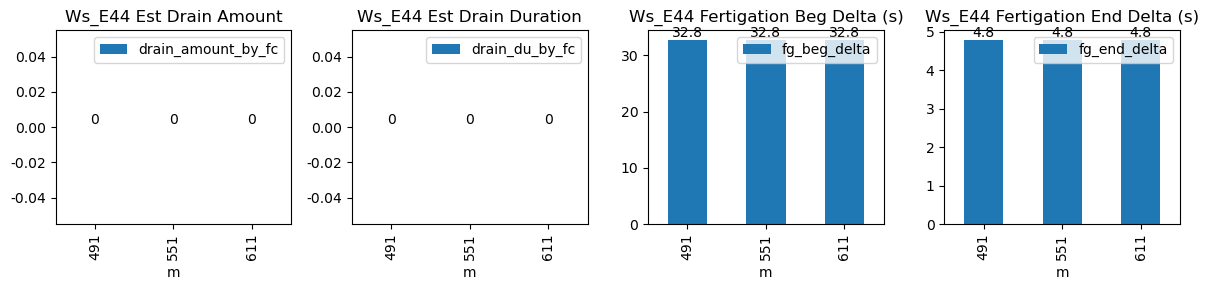
33 |
0.0 |
0.0 |
0.000000 |
NaN |
0.666667 |
22.0 |
32.8 |
4.8 |
22.0 |
0.0 |
-22.000000 |
NaN |
-22.000000 |
| 2025-11-21 09:11:07+08:00 |
46 |
551 |
Ws_E44 |
1.65322 |
30 |
551.12 |
551.666667 |
551.67 |
551.75 |
NaN |
NaN |
NaN |
8630.0 |
8730.0 |
33 |
0.0 |
0.0 |
0.000000 |
NaN |
0.606061 |
20.0 |
32.8 |
4.8 |
20.0 |
0.0 |
-20.000000 |
NaN |
-20.000000 |
| 2025-11-21 10:11:07+08:00 |
46 |
611 |
Ws_E44 |
1.65322 |
30 |
611.12 |
611.666667 |
611.67 |
611.75 |
NaN |
NaN |
NaN |
8730.0 |
8840.0 |
33 |
0.0 |
0.0 |
-0.001852 |
NaN |
0.666667 |
22.0 |
32.8 |
4.8 |
22.0 |
0.0 |
-20.067036 |
NaN |
-20.067036 |