| 2025-11-22 09:00:00+08:00 |
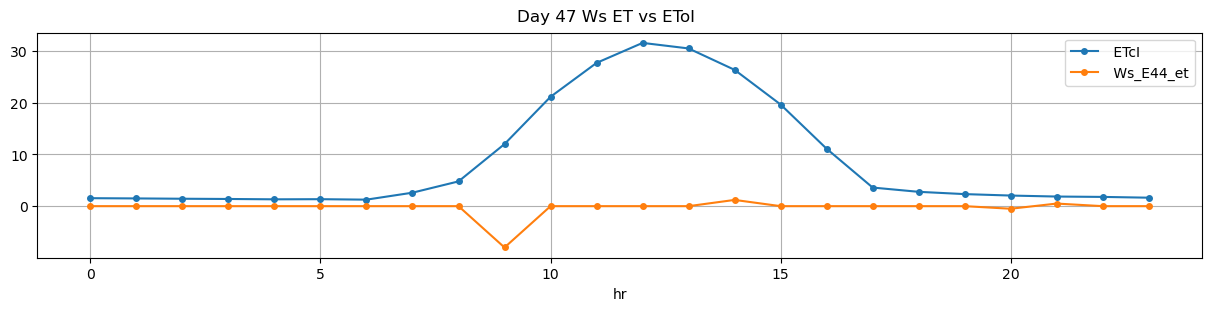
47 |
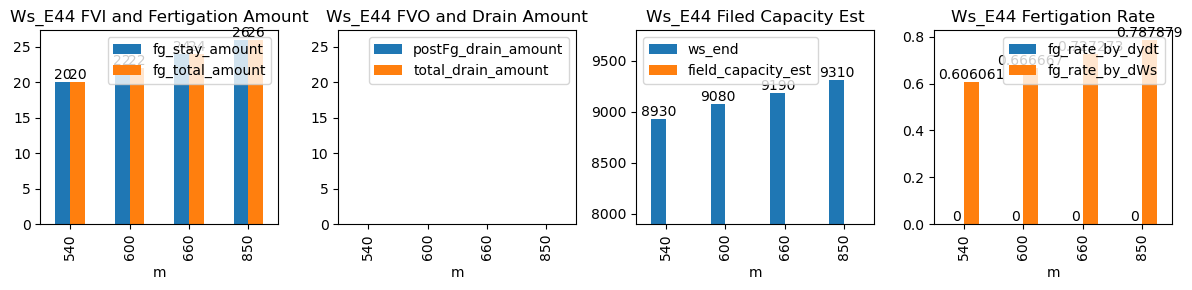
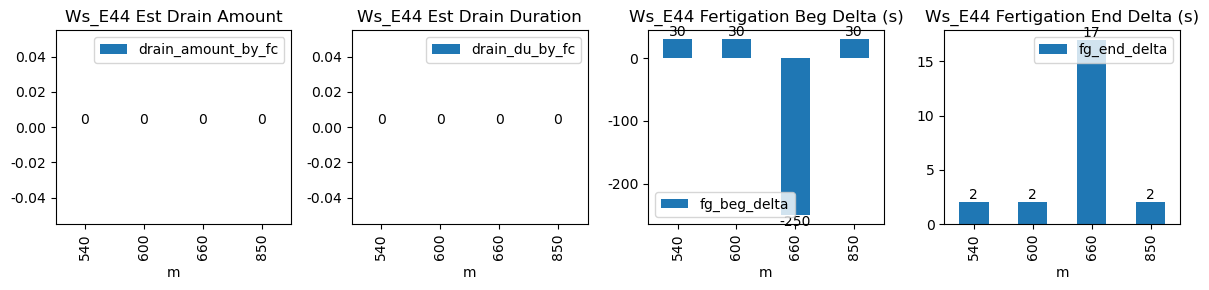
540 |
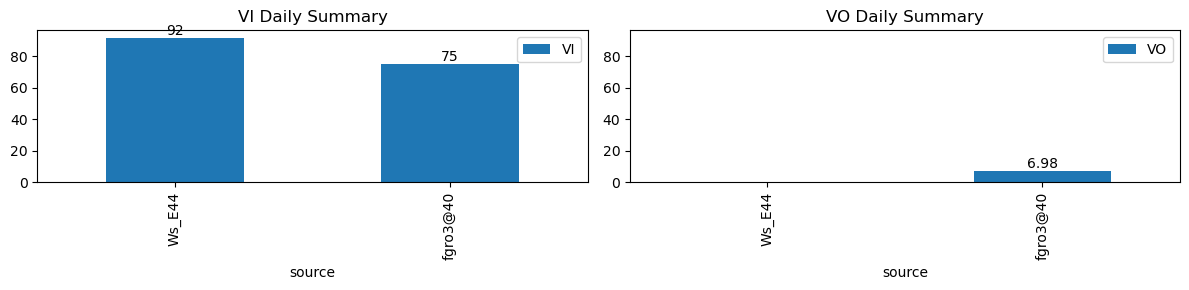
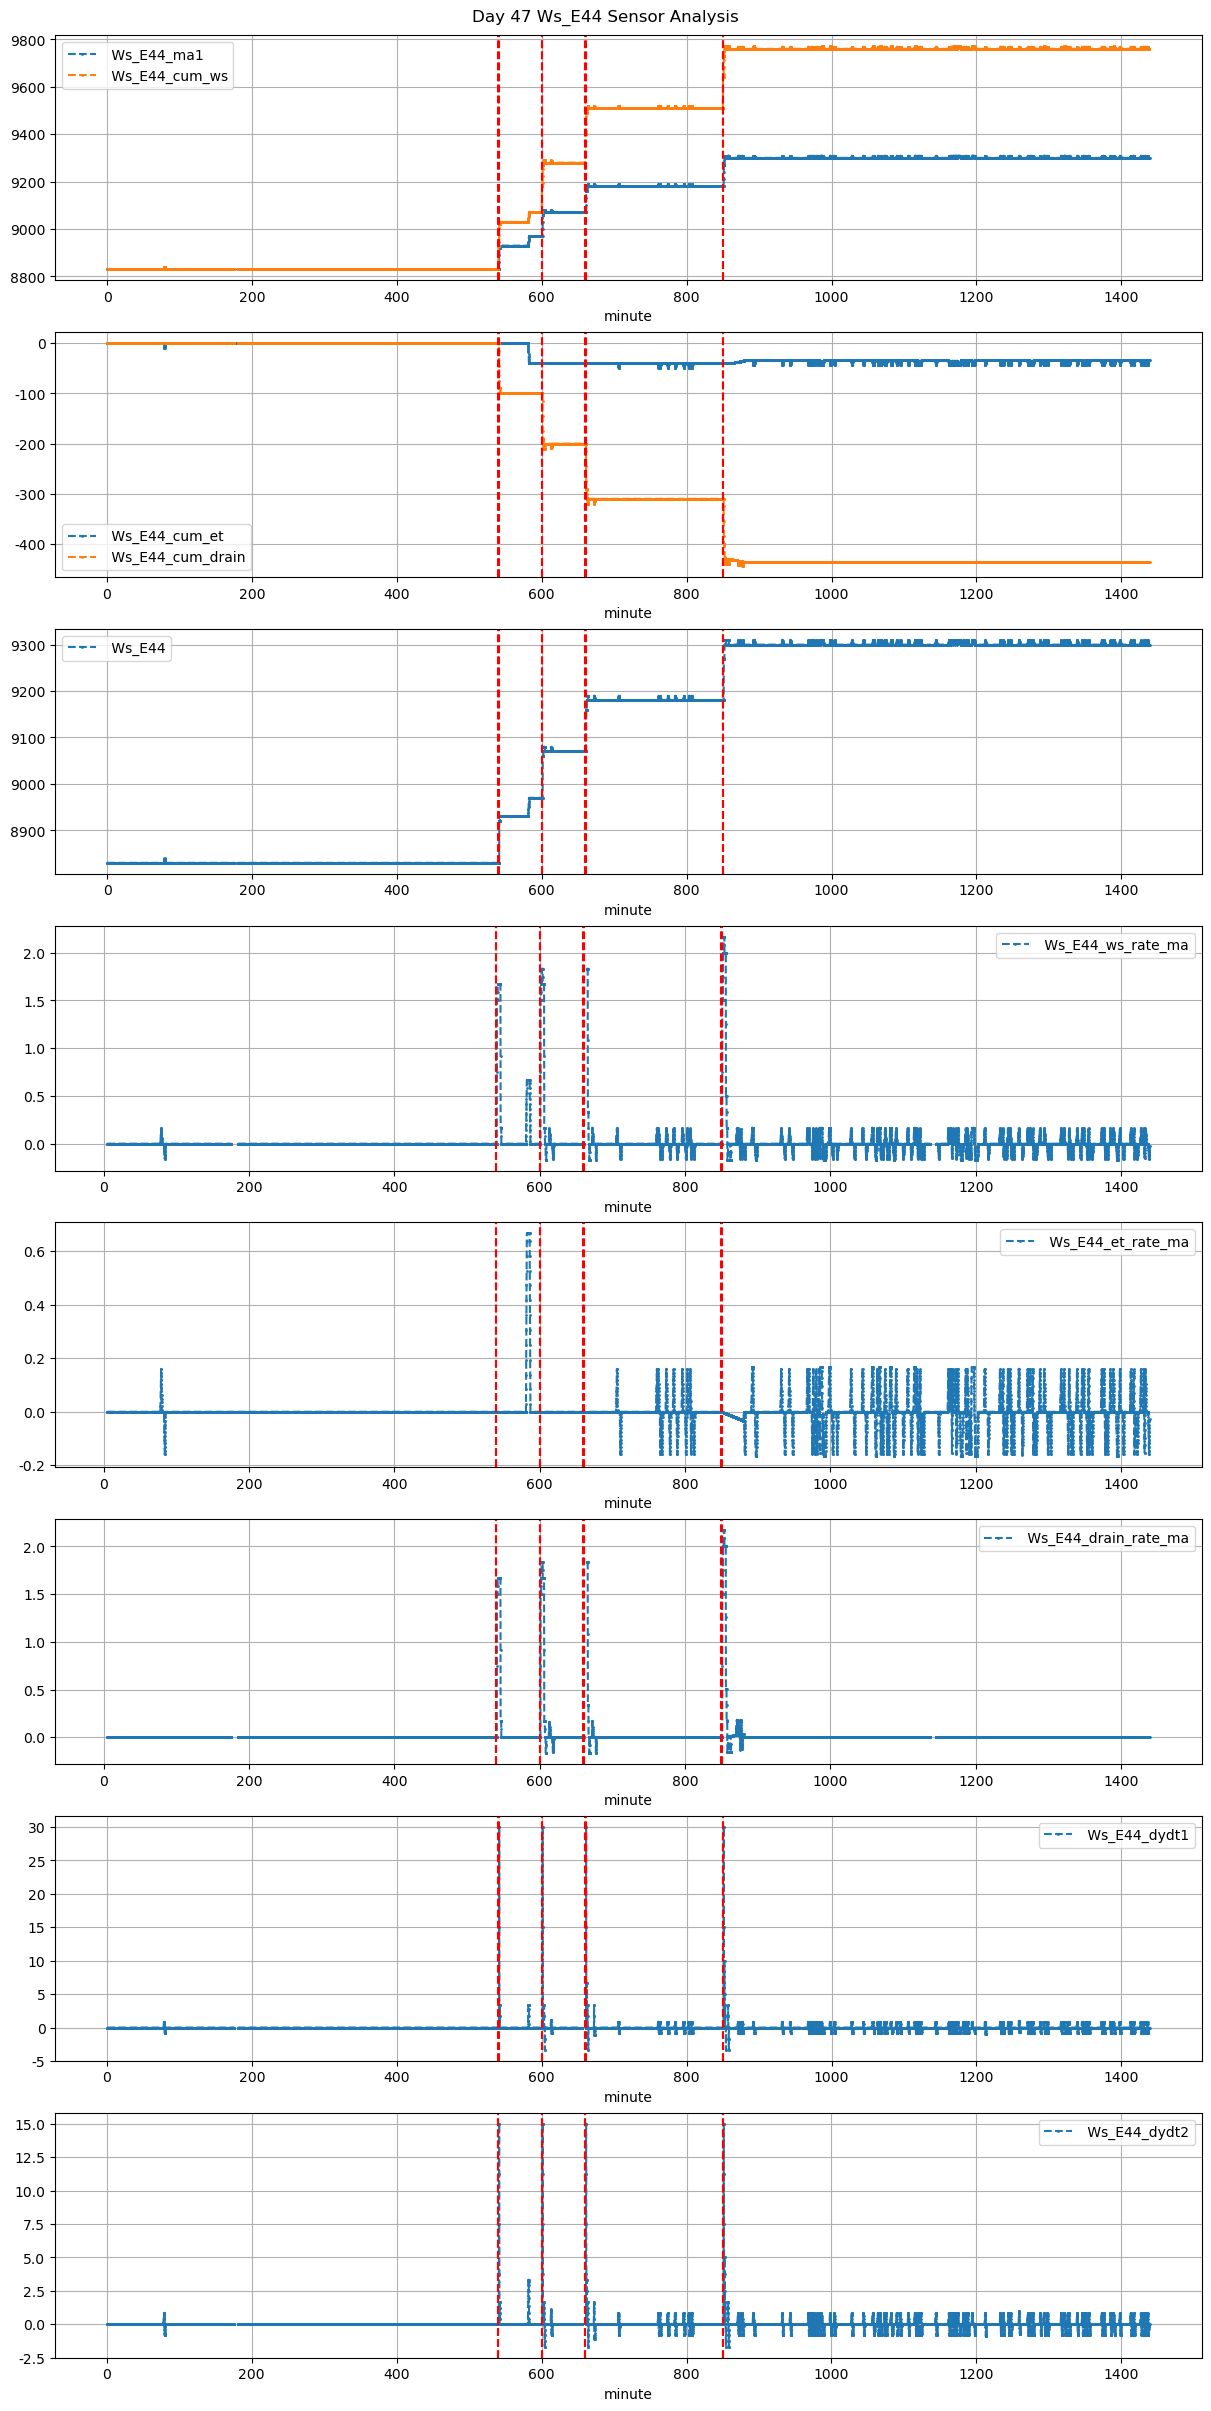
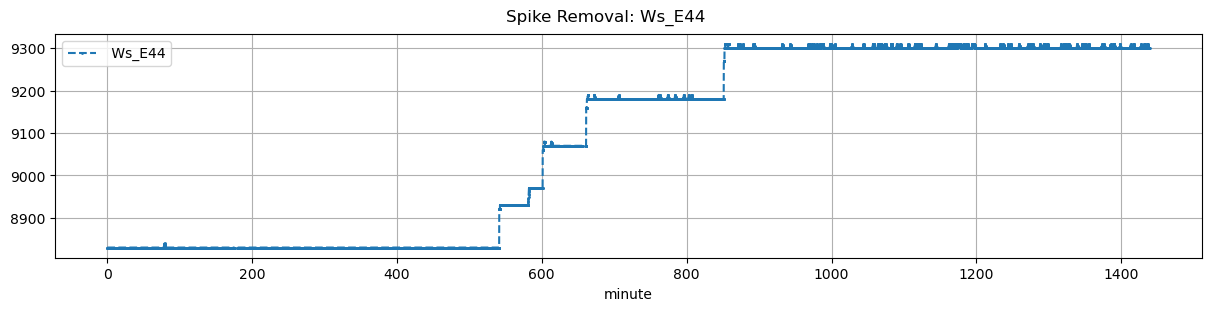
Ws_E44 |
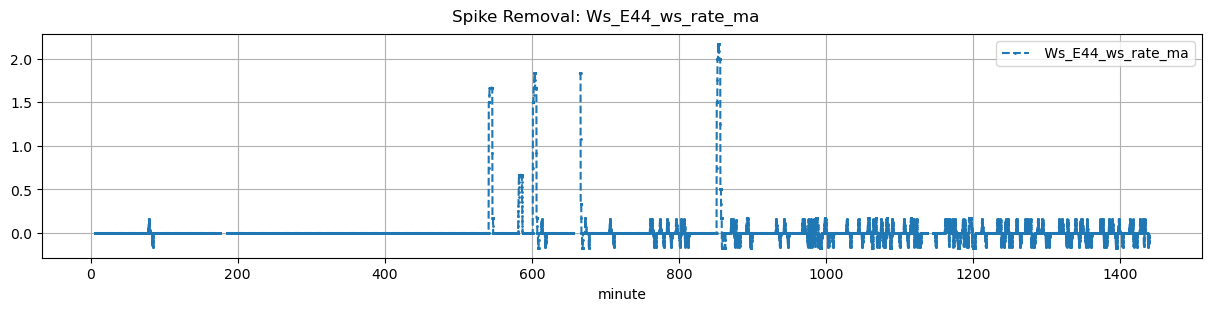
1.522005 |
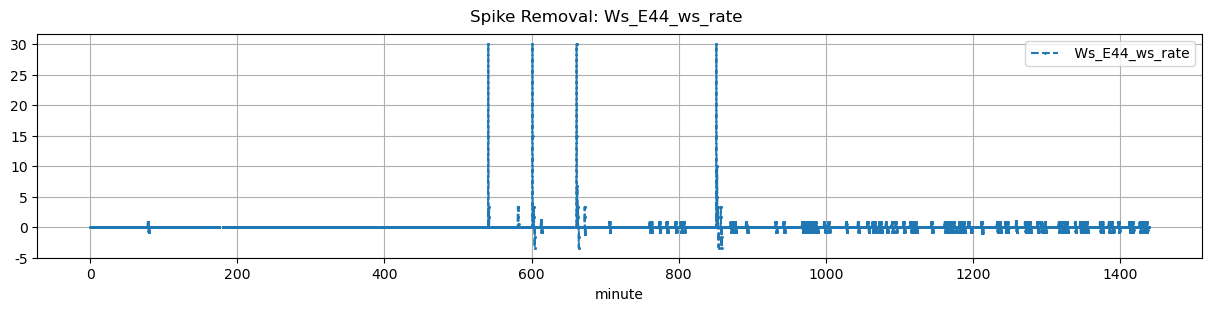
30 |
540.0 |
540.500000 |
540.55 |
540.583333 |
NaN |
NaN |
NaN |
8830.0 |
8930.0 |
33 |
0.0 |
0.0 |
0.000000 |
NaN |
0.606061 |
20.0 |
30.0 |
2.0 |
20.0 |
0.0 |
-20.000000 |
NaN |
-20.000000 |
| 2025-11-22 10:00:00+08:00 |
47 |
600 |
Ws_E44 |
1.522005 |
30 |
600.0 |
600.500000 |
600.55 |
600.583333 |
NaN |
NaN |
NaN |
8970.0 |
9080.0 |
33 |
0.0 |
0.0 |
0.000000 |
NaN |
0.666667 |
22.0 |
30.0 |
2.0 |
22.0 |
0.0 |
-20.000000 |
NaN |
-20.000000 |
| 2025-11-22 11:00:00+08:00 |
47 |
660 |
Ws_E44 |
1.522005 |
30 |
660.0 |
655.833333 |
660.55 |
660.833333 |
NaN |
NaN |
NaN |
9070.0 |
9190.0 |
33 |
0.0 |
0.0 |
0.000000 |
0.0 |
0.727273 |
24.0 |
-250.0 |
17.0 |
24.0 |
0.0 |
-22.000000 |
NaN |
-22.000000 |
| 2025-11-22 14:10:00+08:00 |
47 |
850 |
Ws_E44 |
1.522005 |
30 |
850.0 |
850.500000 |
850.55 |
850.583333 |
NaN |
NaN |
NaN |
9180.0 |
9310.0 |
33 |
0.0 |
0.0 |
-0.033333 |
NaN |
0.787879 |
26.0 |
30.0 |
2.0 |
26.0 |
0.0 |
-25.206648 |
NaN |
-25.206648 |