| 2025-11-23 09:00:00+08:00 |
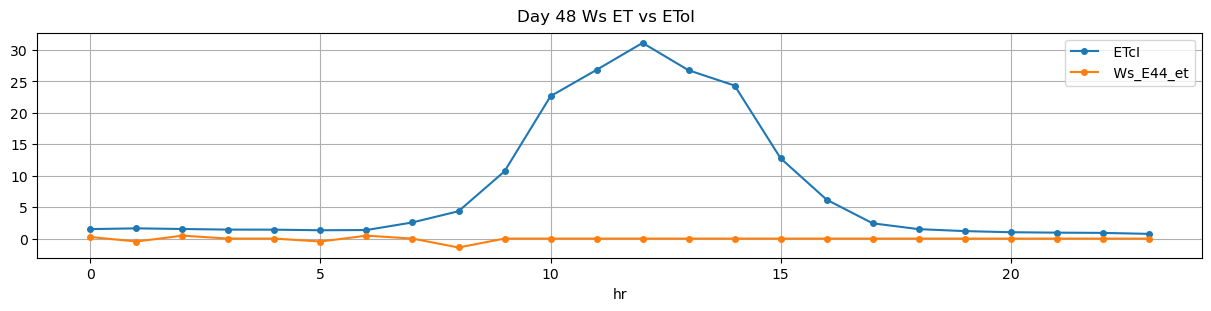
48 |
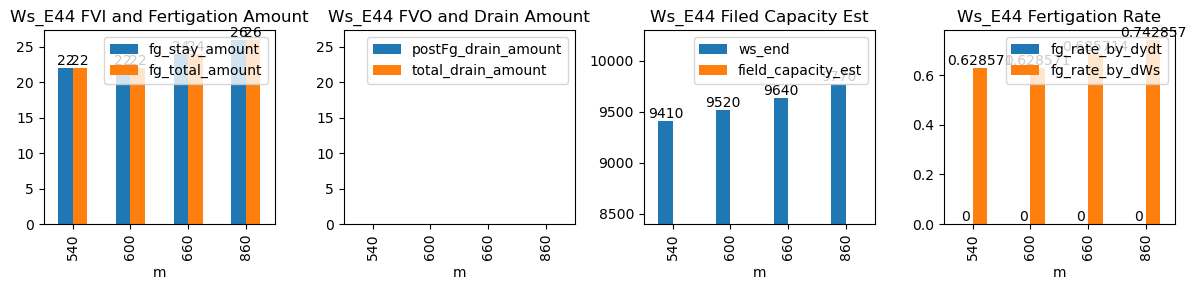
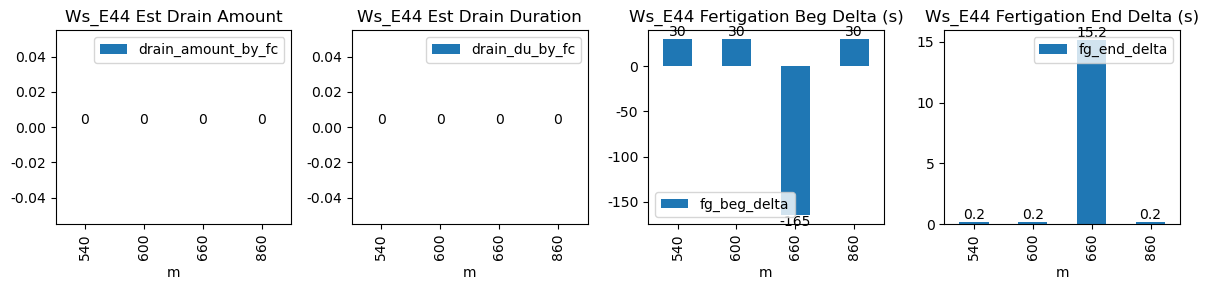
540 |
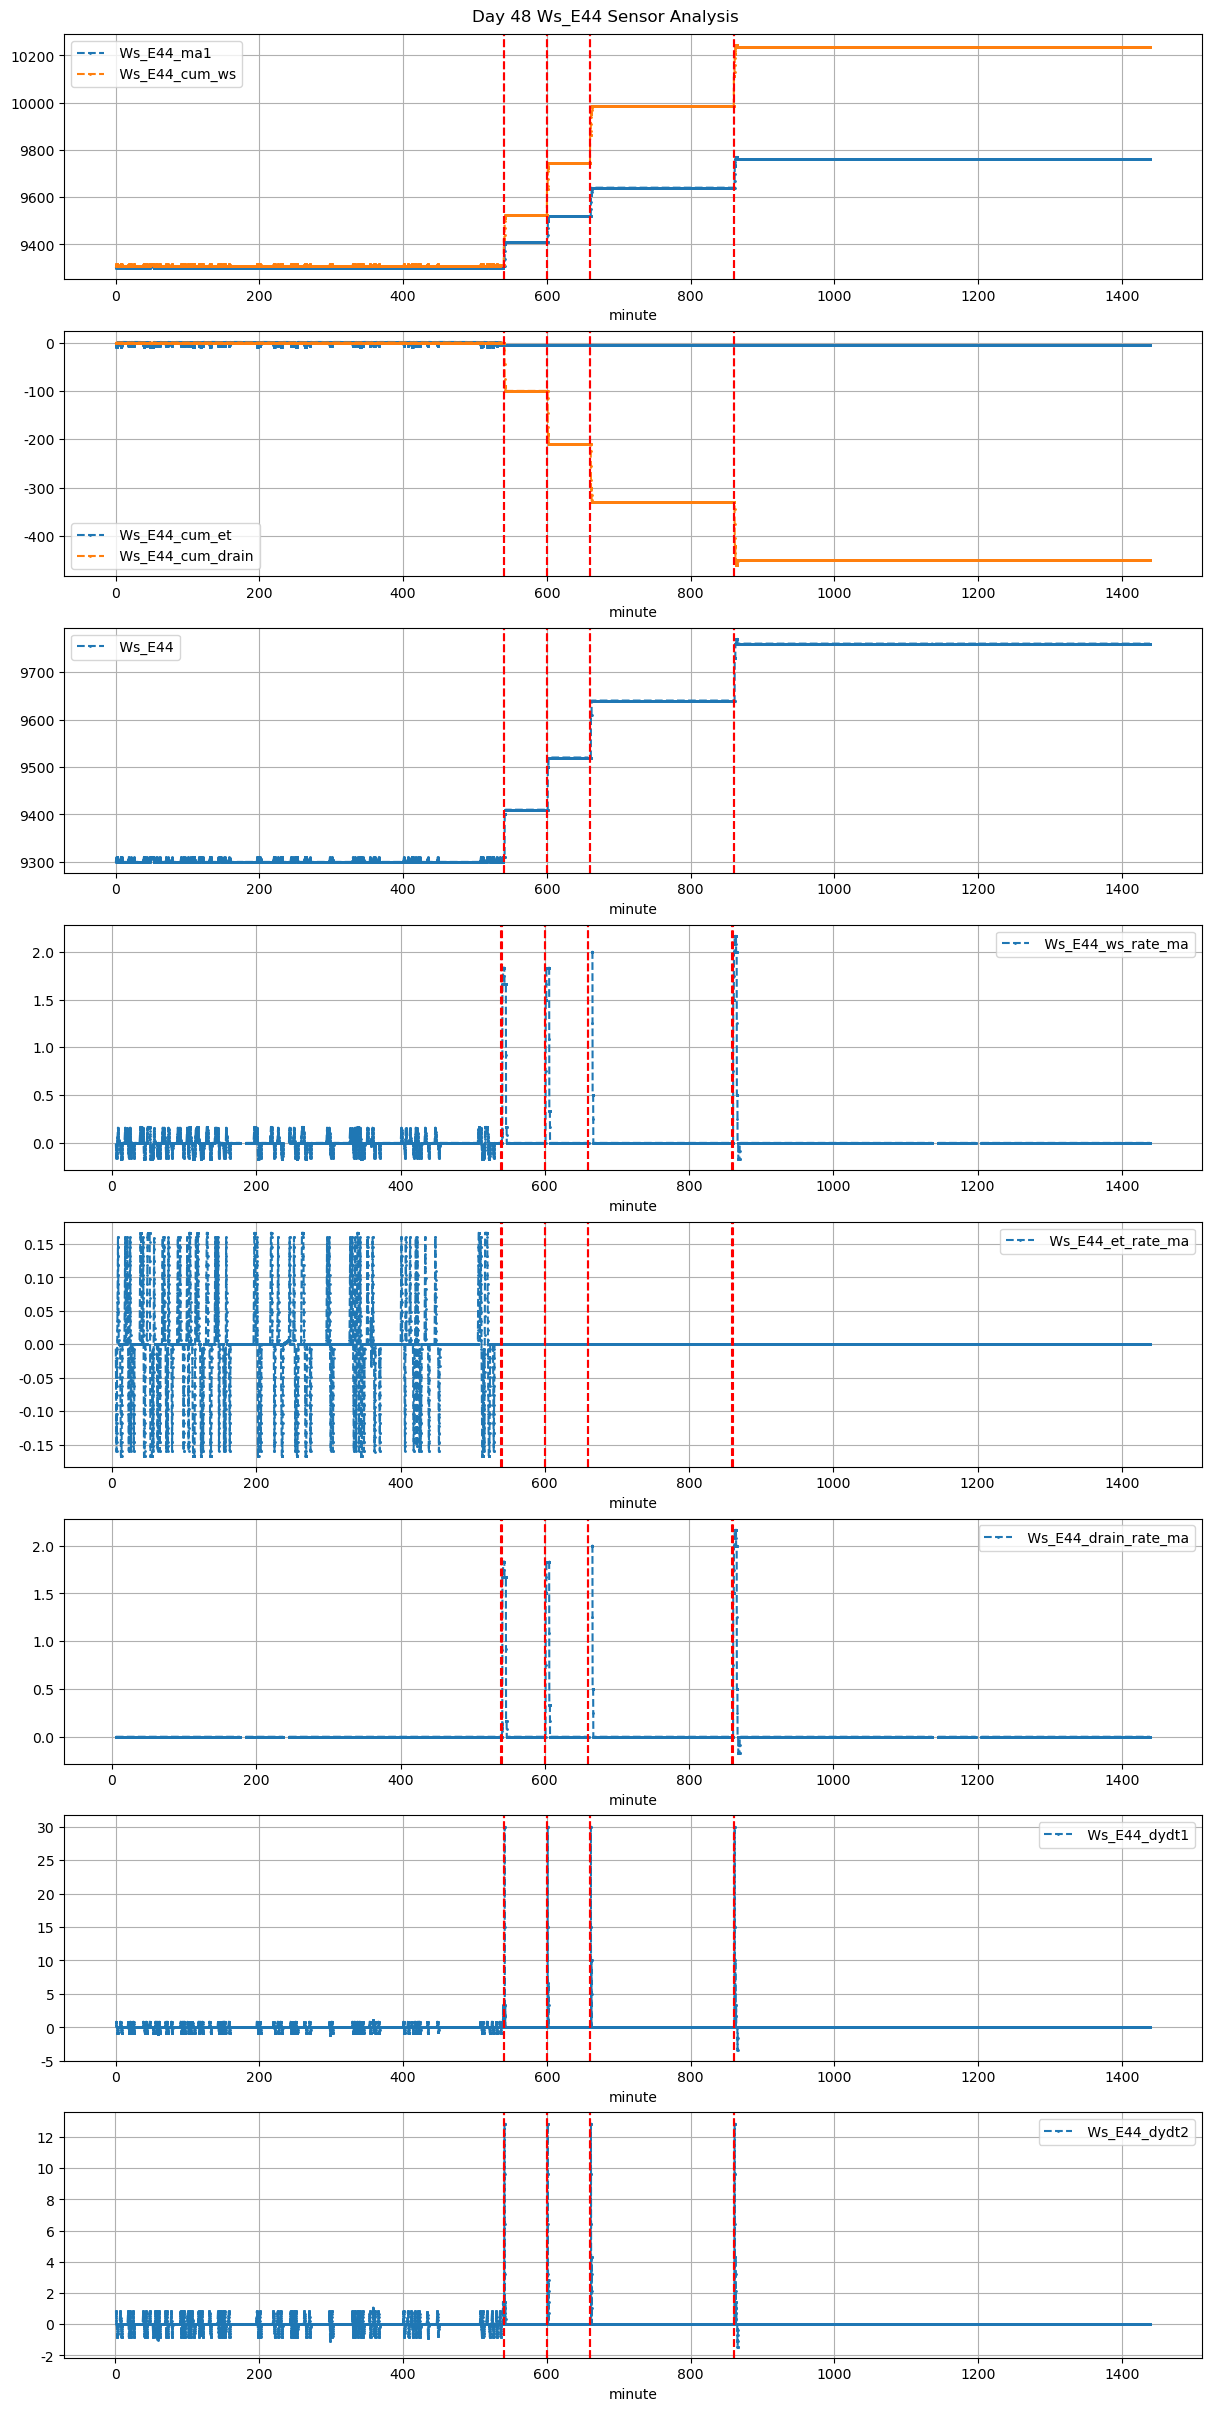
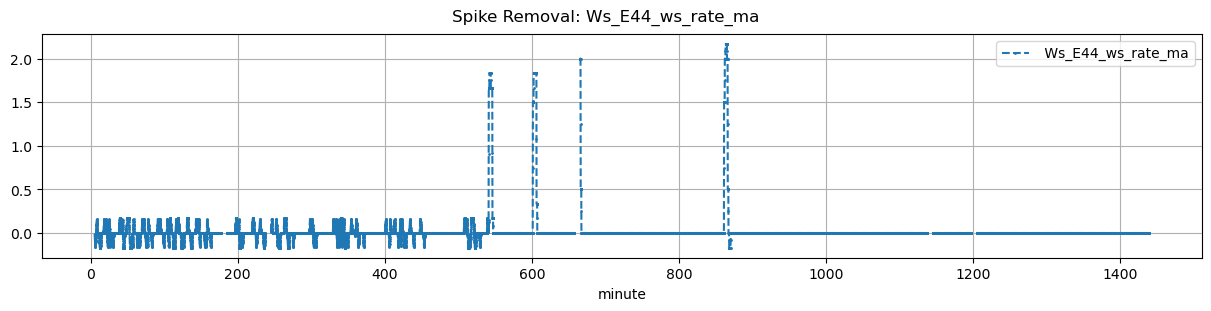
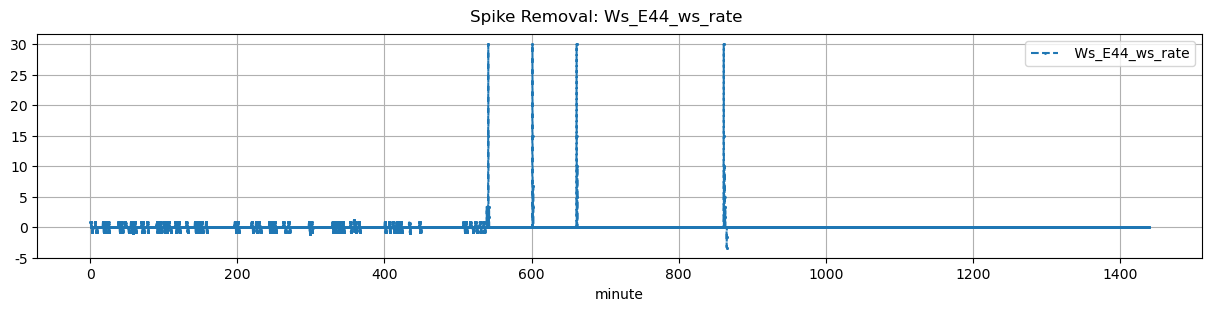
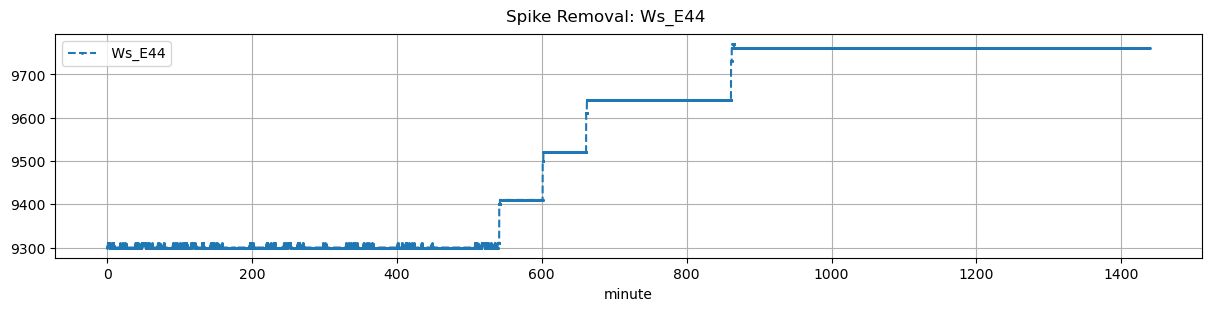
Ws_E44 |
1.415941 |
30 |
540.0 |
540.50 |
540.58 |
540.583333 |
NaN |
NaN |
NaN |
9300.0 |
9410.0 |
35 |
0.0 |
0.0 |
0.0 |
NaN |
0.628571 |
22.0 |
30.0 |
0.2 |
22.0 |
0.0 |
-20.0 |
NaN |
-20.0 |
| 2025-11-23 10:00:00+08:00 |
48 |
600 |
Ws_E44 |
1.415941 |
30 |
600.0 |
600.50 |
600.58 |
600.583333 |
NaN |
NaN |
NaN |
9410.0 |
9520.0 |
35 |
0.0 |
0.0 |
0.0 |
NaN |
0.628571 |
22.0 |
30.0 |
0.2 |
22.0 |
0.0 |
-22.0 |
NaN |
-22.0 |
| 2025-11-23 11:00:00+08:00 |
48 |
660 |
Ws_E44 |
1.415941 |
30 |
660.0 |
657.25 |
660.58 |
660.833333 |
NaN |
NaN |
NaN |
9520.0 |
9640.0 |
35 |
0.0 |
0.0 |
0.0 |
0.0 |
0.685714 |
24.0 |
-165.0 |
15.2 |
24.0 |
0.0 |
-24.0 |
NaN |
-24.0 |
| 2025-11-23 14:20:00+08:00 |
48 |
860 |
Ws_E44 |
1.415941 |
30 |
860.0 |
860.50 |
860.58 |
860.583333 |
NaN |
NaN |
NaN |
9640.0 |
9770.0 |
35 |
0.0 |
0.0 |
0.0 |
NaN |
0.742857 |
26.0 |
30.0 |
0.2 |
26.0 |
0.0 |
-24.0 |
NaN |
-24.0 |