| 2025-11-24 08:50:00+08:00 |
49 |
530 |
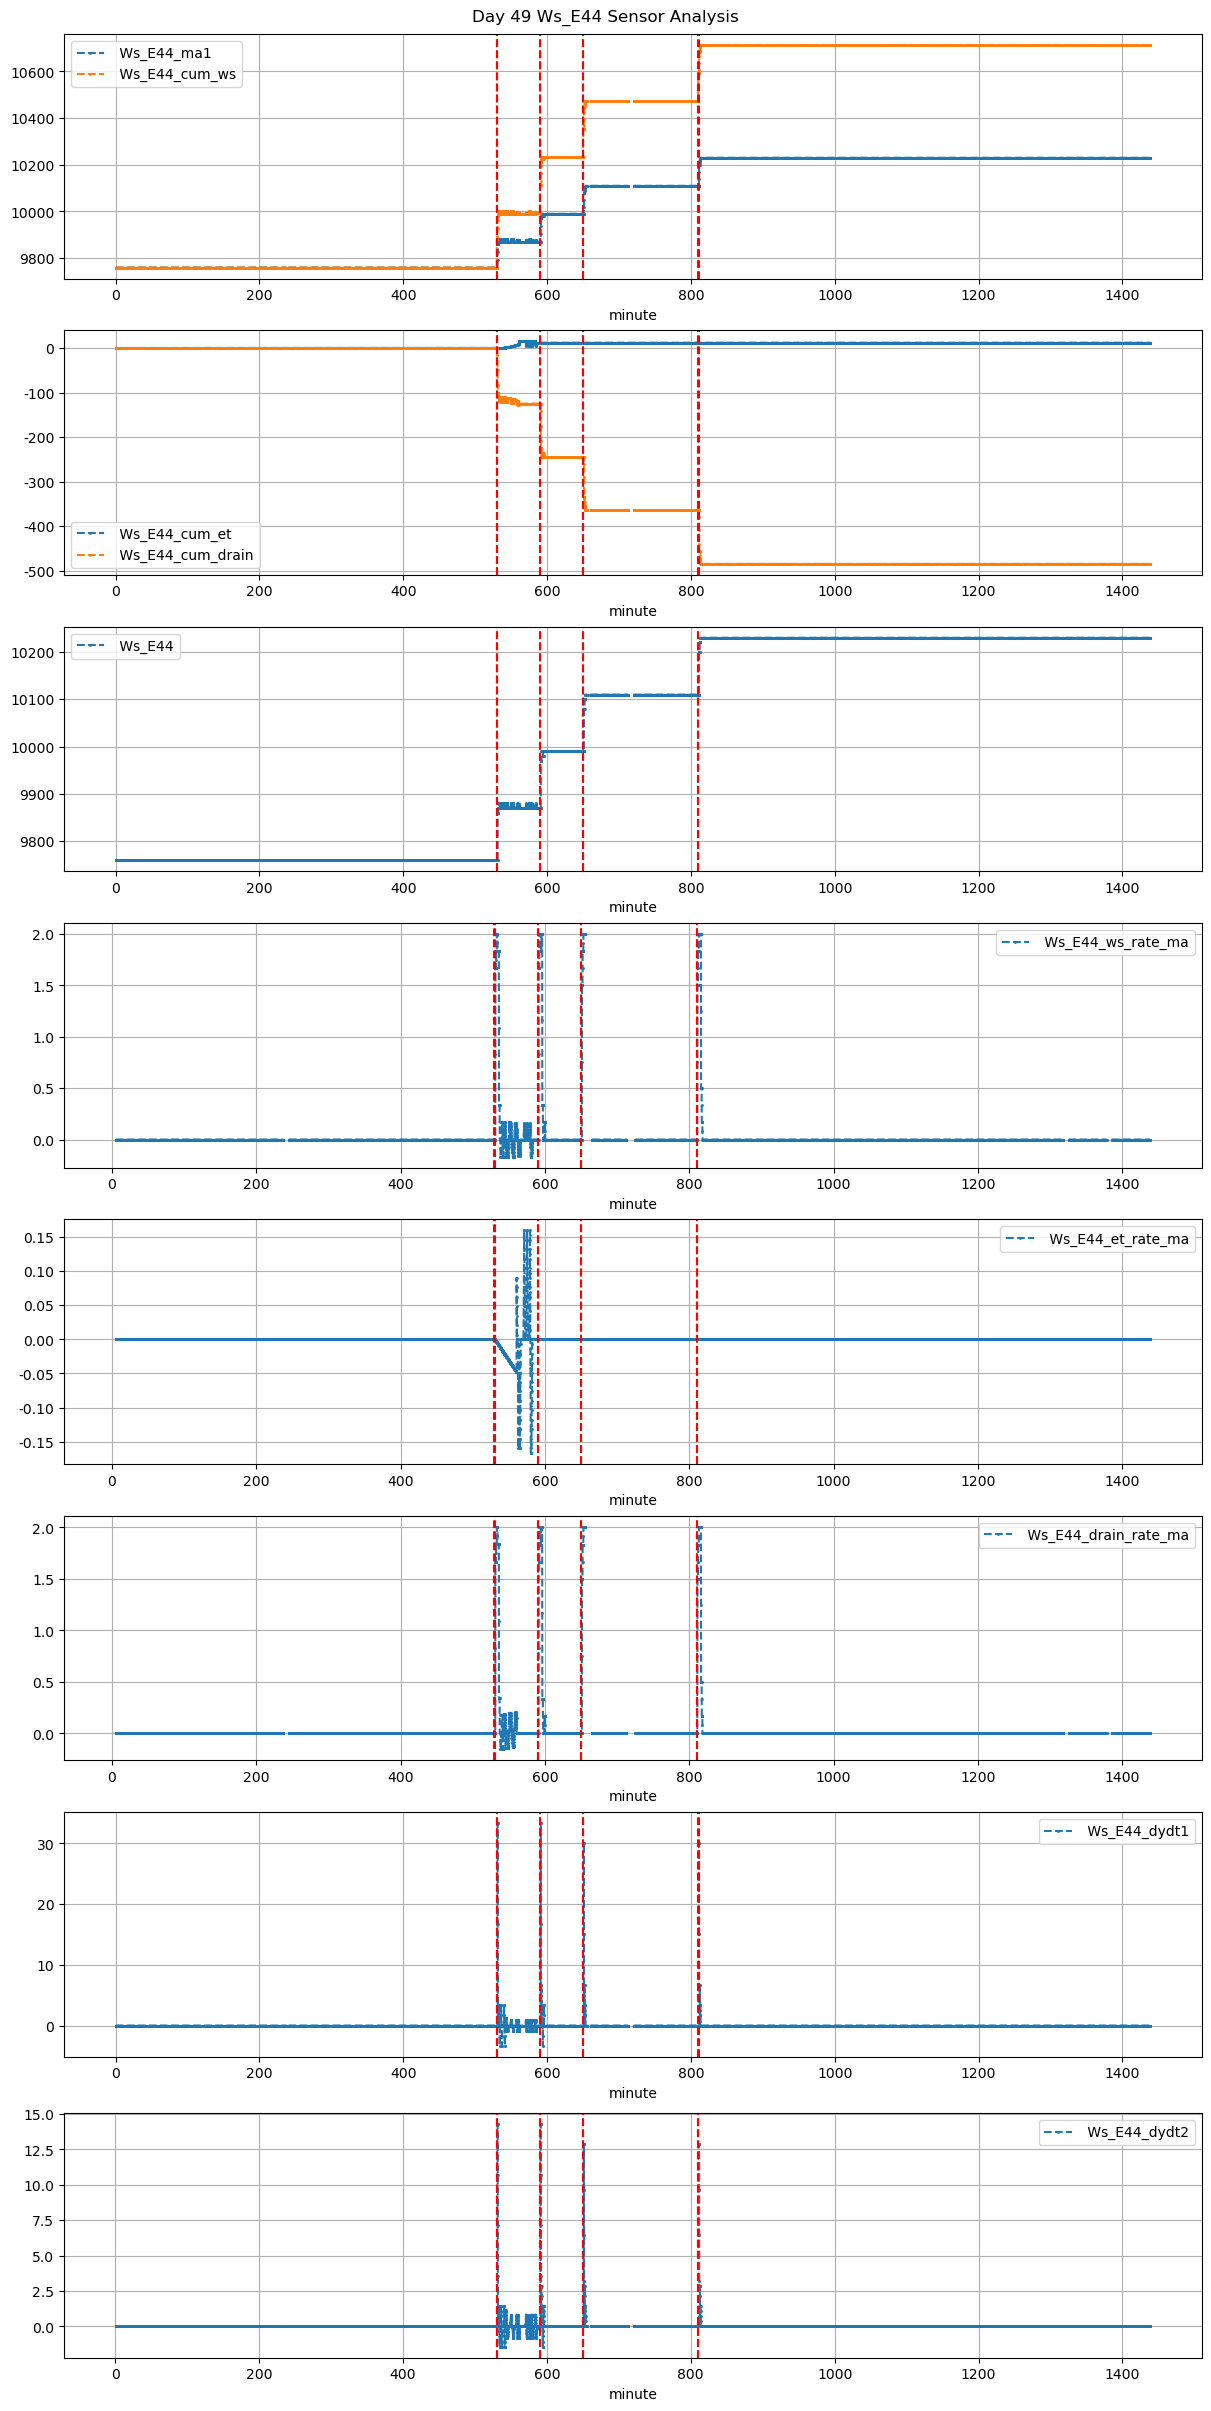
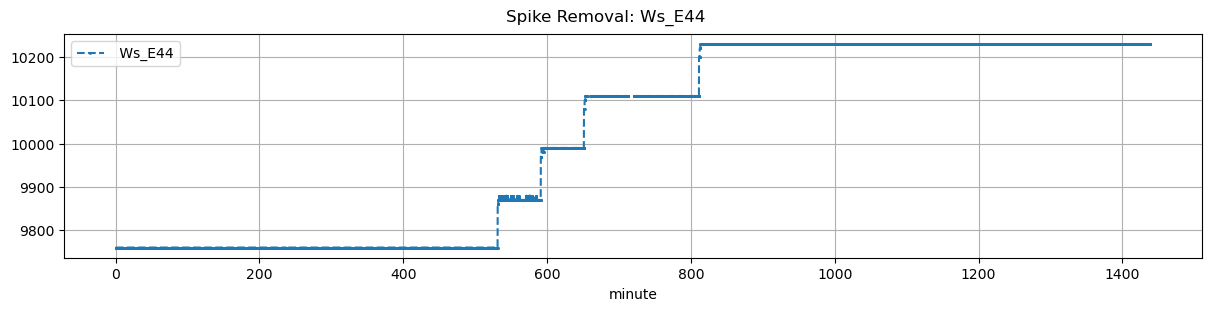
Ws_E44 |
1.929404 |
30 |
530.0 |
530.5 |
530.58 |
530.583333 |
NaN |
NaN |
NaN |
9760.0 |
9880.0 |
35 |
0.000000 |
0.0 |
-0.047917 |
NaN |
0.685714 |
24.0 |
30.0 |
0.2 |
24.0 |
0.0 |
-24.984557 |
NaN |
-24.984557 |
| 2025-11-24 09:50:00+08:00 |
49 |
590 |
Ws_E44 |
1.929404 |
30 |
590.0 |
590.5 |
590.58 |
590.583333 |
NaN |
NaN |
NaN |
9870.0 |
9990.0 |
35 |
-0.032839 |
0.0 |
0.000000 |
NaN |
0.685714 |
24.0 |
30.0 |
0.2 |
24.0 |
0.0 |
-24.000000 |
NaN |
-24.000000 |
| 2025-11-24 10:50:00+08:00 |
49 |
650 |
Ws_E44 |
1.929404 |
30 |
650.0 |
650.5 |
650.58 |
650.583333 |
NaN |
NaN |
NaN |
9990.0 |
10110.0 |
35 |
0.000000 |
0.0 |
0.000000 |
NaN |
0.685714 |
24.0 |
30.0 |
0.2 |
24.0 |
0.0 |
-24.000000 |
NaN |
-24.000000 |
| 2025-11-24 13:30:00+08:00 |
49 |
810 |
Ws_E44 |
1.929404 |
30 |
810.0 |
810.5 |
810.58 |
810.583333 |
NaN |
NaN |
NaN |
10110.0 |
10230.0 |
35 |
0.000000 |
0.0 |
0.000000 |
NaN |
0.685714 |
24.0 |
30.0 |
0.2 |
24.0 |
0.0 |
-24.000000 |
NaN |
-24.000000 |