| 2025-11-25 08:50:00+08:00 |
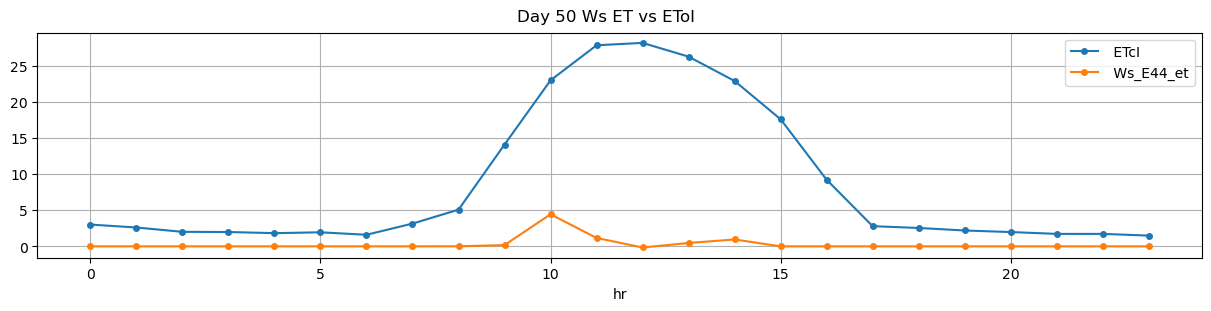
50 |
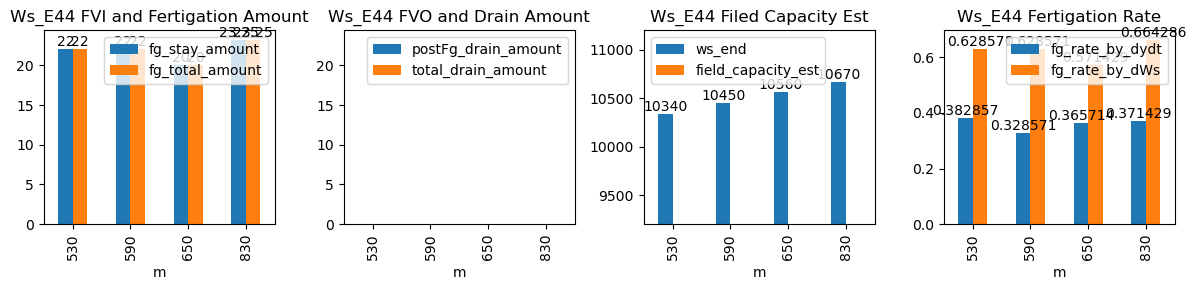
530 |
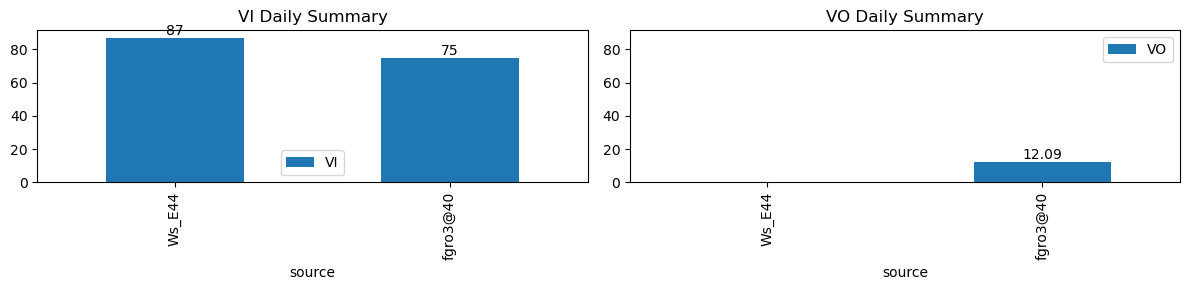
Ws_E44 |
4.299938 |
30 |
530.0 |
530.333333 |
530.58 |
531.750000 |
NaN |
NaN |
NaN |
10230.00 |
10340.0 |
35 |
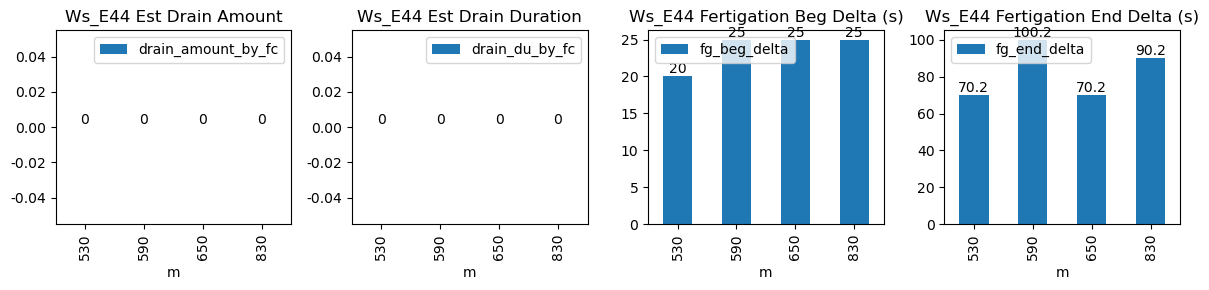
0.000000 |
0.000000 |
-0.002407 |
0.382857 |
0.628571 |
22.00 |
20.0 |
70.2 |
22.00 |
0.0 |
-1.932381 |
NaN |
-1.932381 |
| 2025-11-25 09:50:00+08:00 |
50 |
590 |
Ws_E44 |
4.299938 |
30 |
590.0 |
590.416667 |
590.58 |
592.250000 |
NaN |
NaN |
NaN |
10340.00 |
10450.0 |
35 |
0.000000 |
0.000000 |
-0.131731 |
0.328571 |
0.628571 |
22.00 |
25.0 |
100.2 |
22.00 |
0.0 |
-8.402683 |
NaN |
-8.402683 |
| 2025-11-25 10:50:00+08:00 |
50 |
650 |
Ws_E44 |
4.299938 |
30 |
650.0 |
650.416667 |
650.58 |
651.750000 |
NaN |
NaN |
NaN |
10460.00 |
10560.0 |
35 |
0.000000 |
-0.001389 |
0.000000 |
0.365714 |
0.571429 |
20.00 |
25.0 |
70.2 |
20.00 |
0.0 |
-0.600000 |
NaN |
-0.600000 |
| 2025-11-25 13:50:00+08:00 |
50 |
830 |
Ws_E44 |
4.299938 |
30 |
830.0 |
830.416667 |
830.58 |
832.083333 |
NaN |
NaN |
NaN |
10553.75 |
10670.0 |
35 |
-0.017891 |
-0.018056 |
-0.035833 |
0.371429 |
0.664286 |
23.25 |
25.0 |
90.2 |
23.25 |
0.0 |
-3.813755 |
NaN |
-3.813755 |