| 2025-11-26 08:51:05+08:00 |
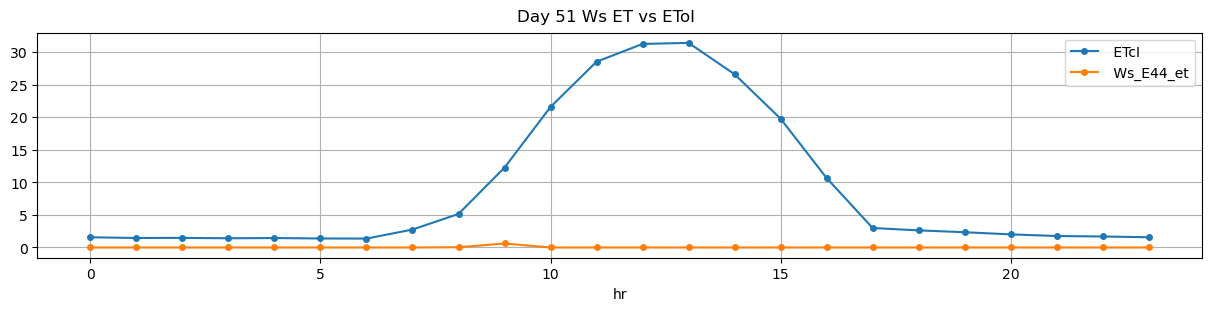
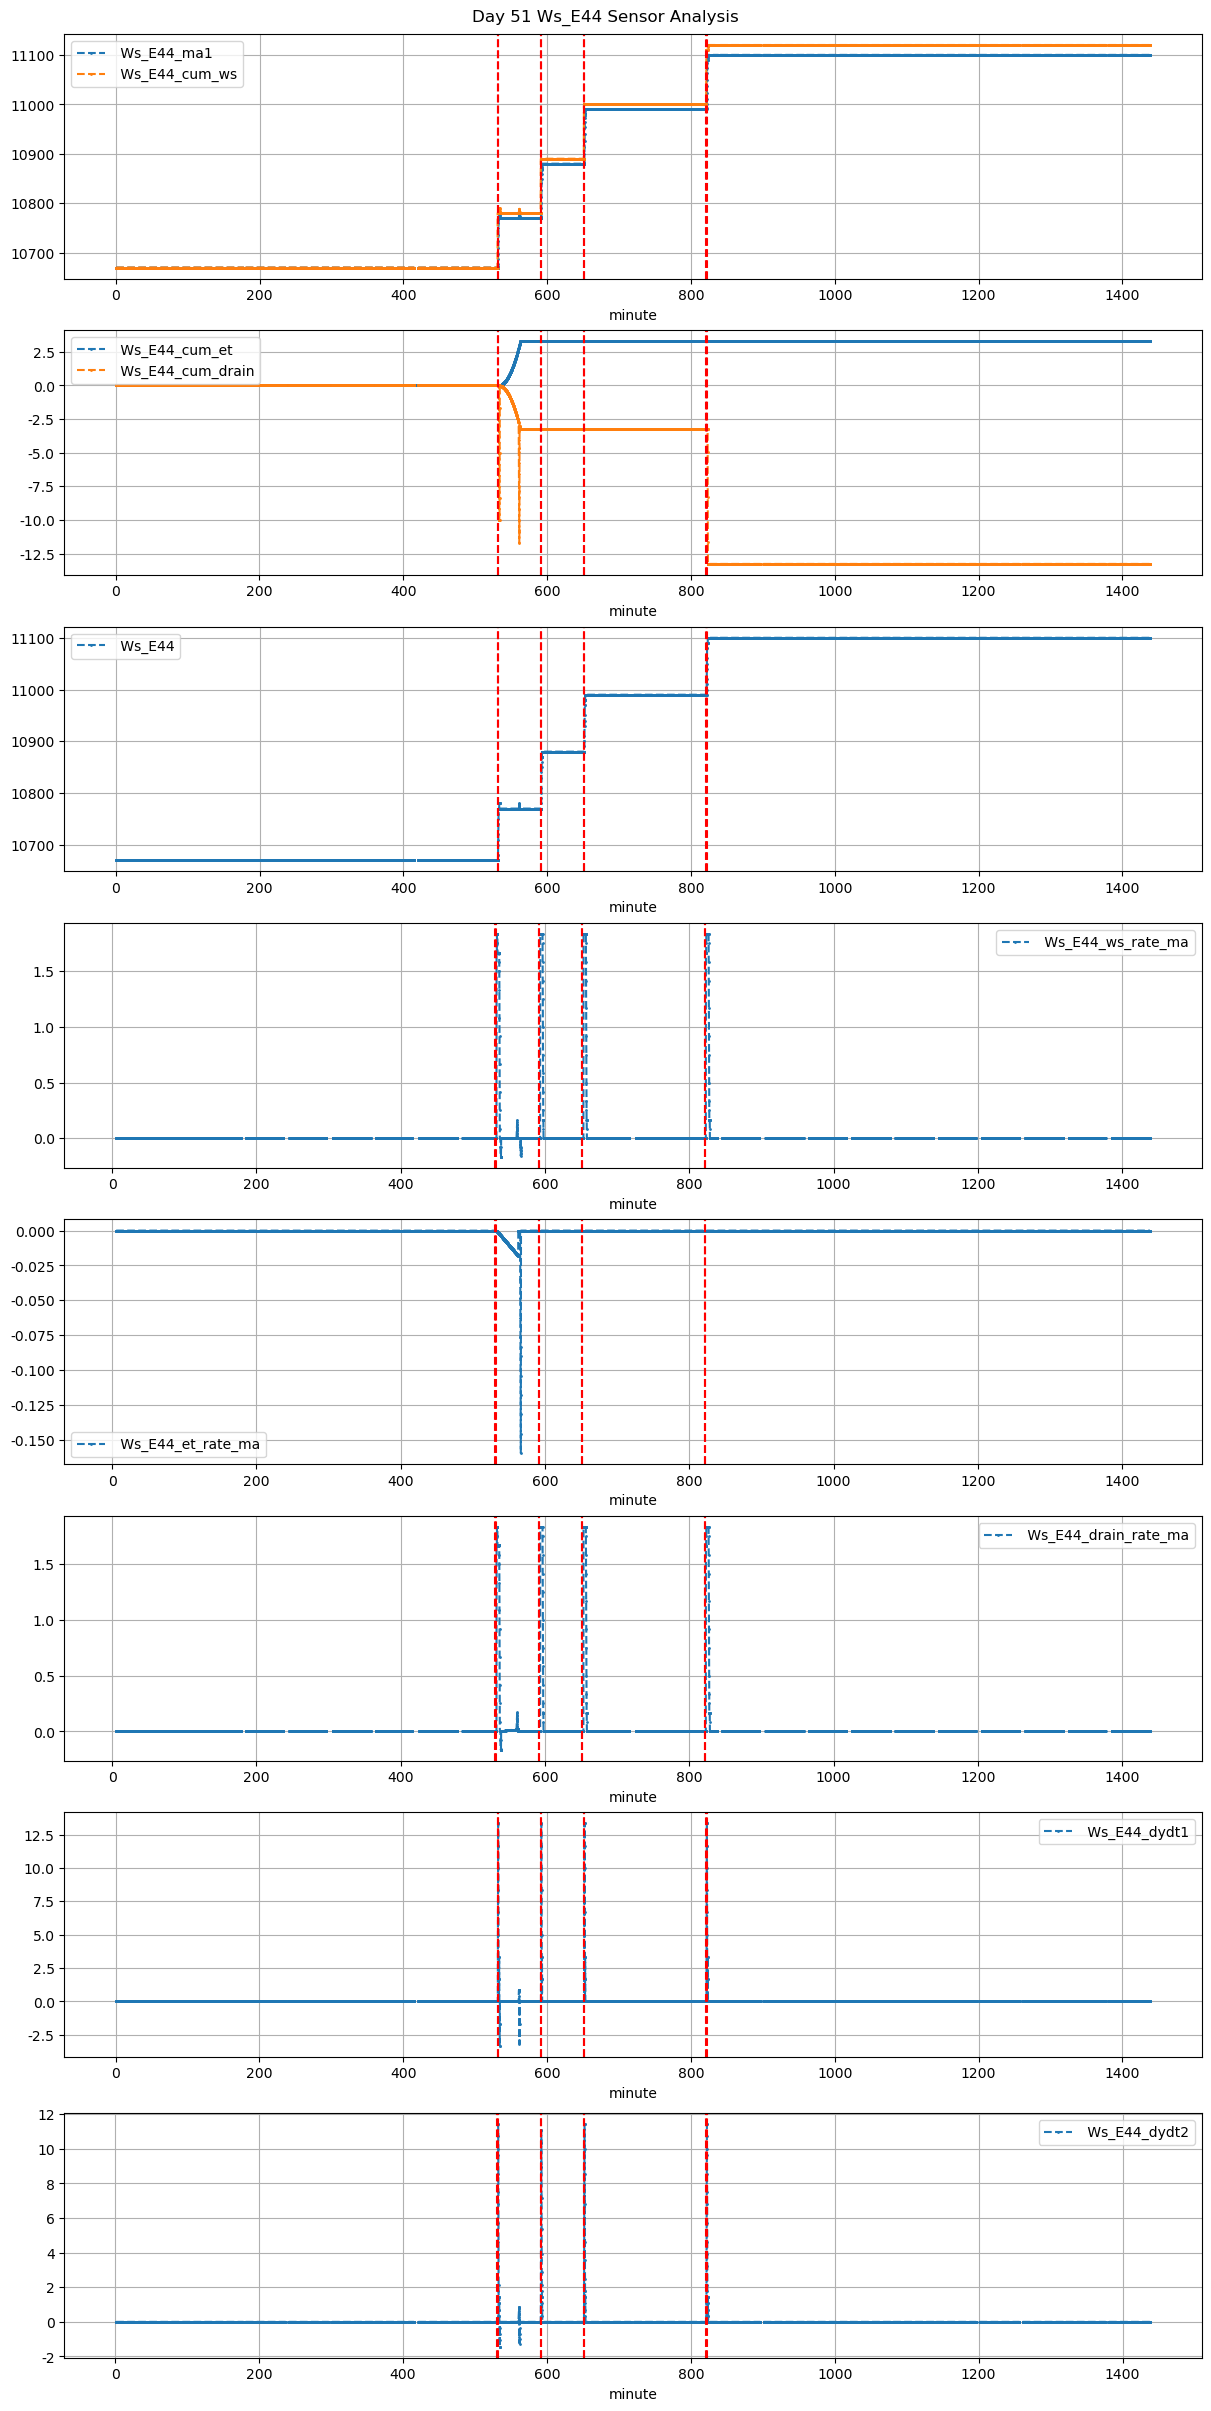
51 |
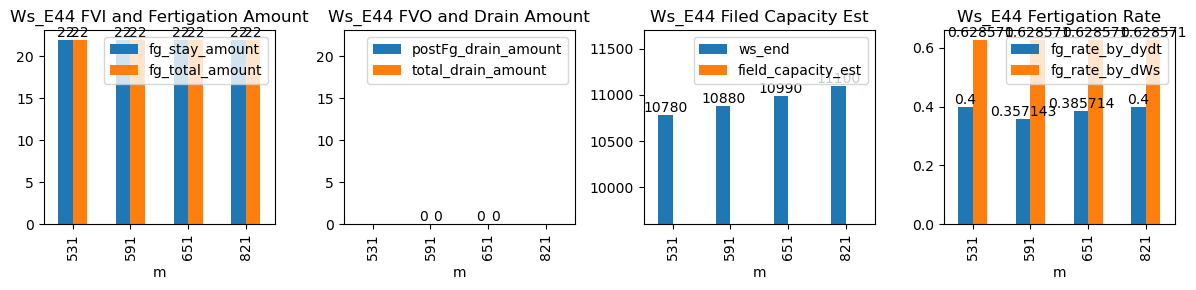
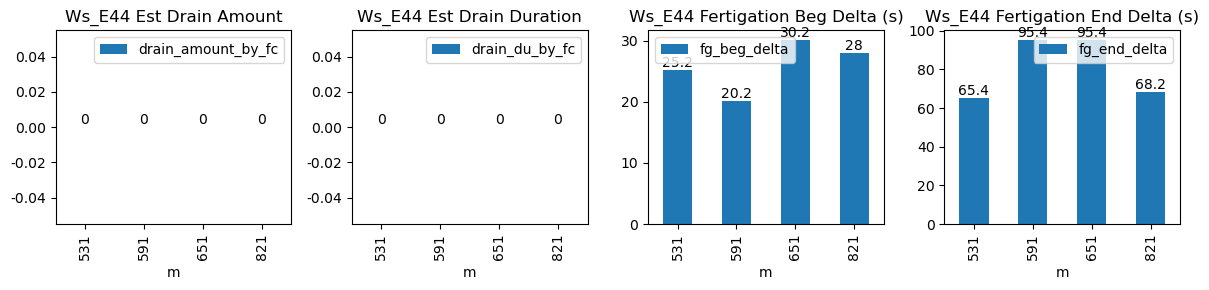
531 |
Ws_E44 |
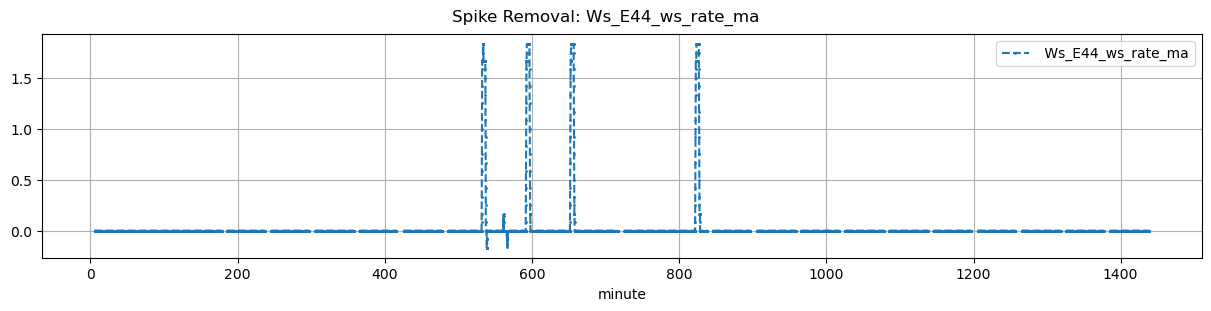
1.871942 |
30 |
531.08 |
531.500000 |
531.66 |
532.750000 |
NaN |
NaN |
NaN |
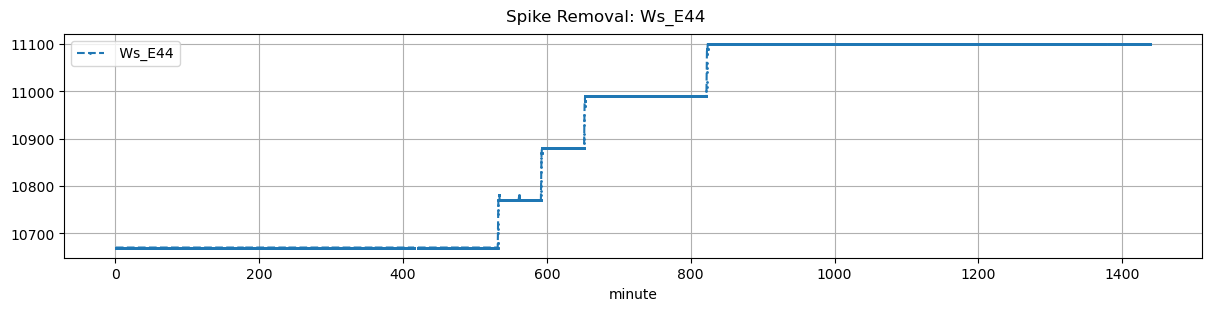
10670.0 |
10780.0 |
35 |
0.0 |
-0.025 |
-0.018056 |
0.400000 |
0.628571 |
22.0 |
25.2 |
65.4 |
22.0 |
0.0 |
-0.607447 |
NaN |
-0.607447 |
| 2025-11-26 09:51:05+08:00 |
51 |
591 |
Ws_E44 |
1.871942 |
30 |
591.08 |
591.416667 |
591.66 |
593.250000 |
NaN |
NaN |
NaN |
10770.0 |
10880.0 |
35 |
0.0 |
0.000 |
0.000000 |
0.357143 |
0.628571 |
22.0 |
20.2 |
95.4 |
22.0 |
0.0 |
0.000000 |
NaN |
0.000000 |
| 2025-11-26 10:51:05+08:00 |
51 |
651 |
Ws_E44 |
1.871942 |
30 |
651.08 |
651.583333 |
651.66 |
653.250000 |
NaN |
NaN |
NaN |
10880.0 |
10990.0 |
35 |
0.0 |
0.000 |
0.000000 |
0.385714 |
0.628571 |
22.0 |
30.2 |
95.4 |
22.0 |
0.0 |
0.000000 |
NaN |
0.000000 |
| 2025-11-26 13:41:12+08:00 |
51 |
821 |
Ws_E44 |
1.871942 |
30 |
821.20 |
821.666667 |
821.78 |
822.916667 |
NaN |
NaN |
NaN |
10990.0 |
11100.0 |
35 |
0.0 |
0.000 |
0.000000 |
0.400000 |
0.628571 |
22.0 |
28.0 |
68.2 |
22.0 |
0.0 |
-2.000000 |
NaN |
-2.000000 |