| 2025-11-27 07:55:00+08:00 |
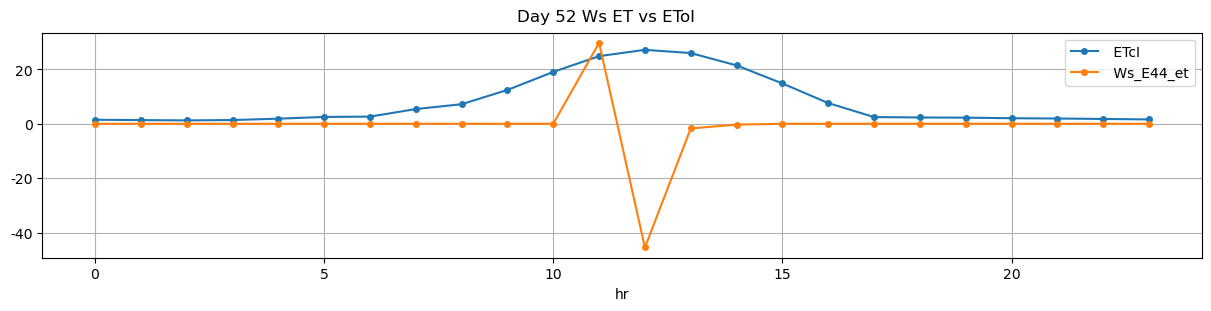
52 |
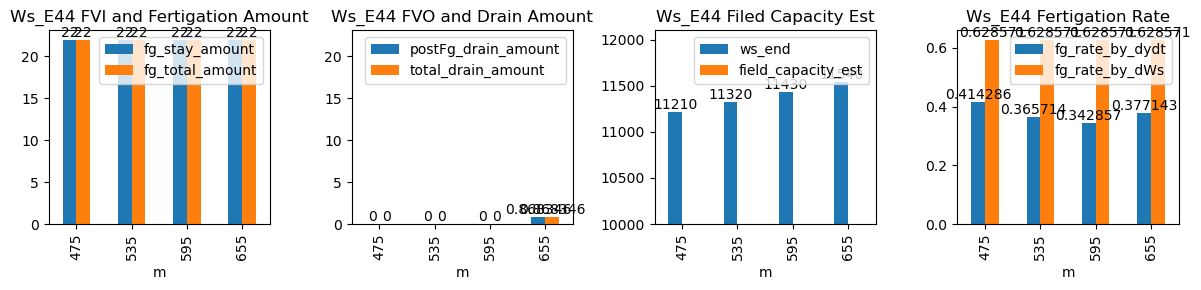
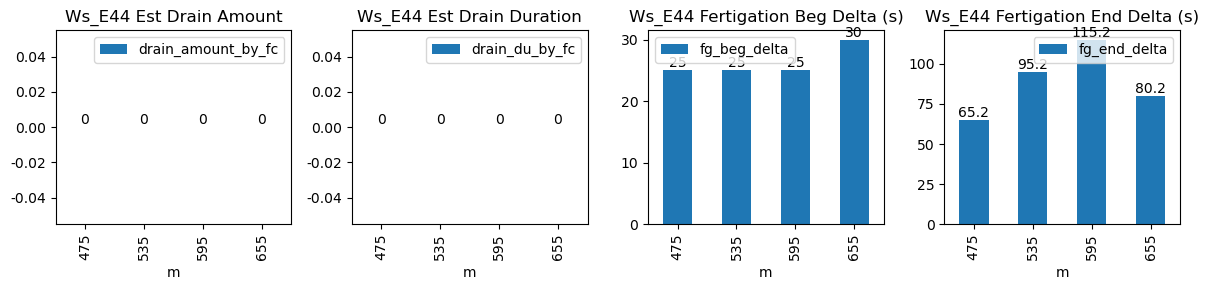
475 |
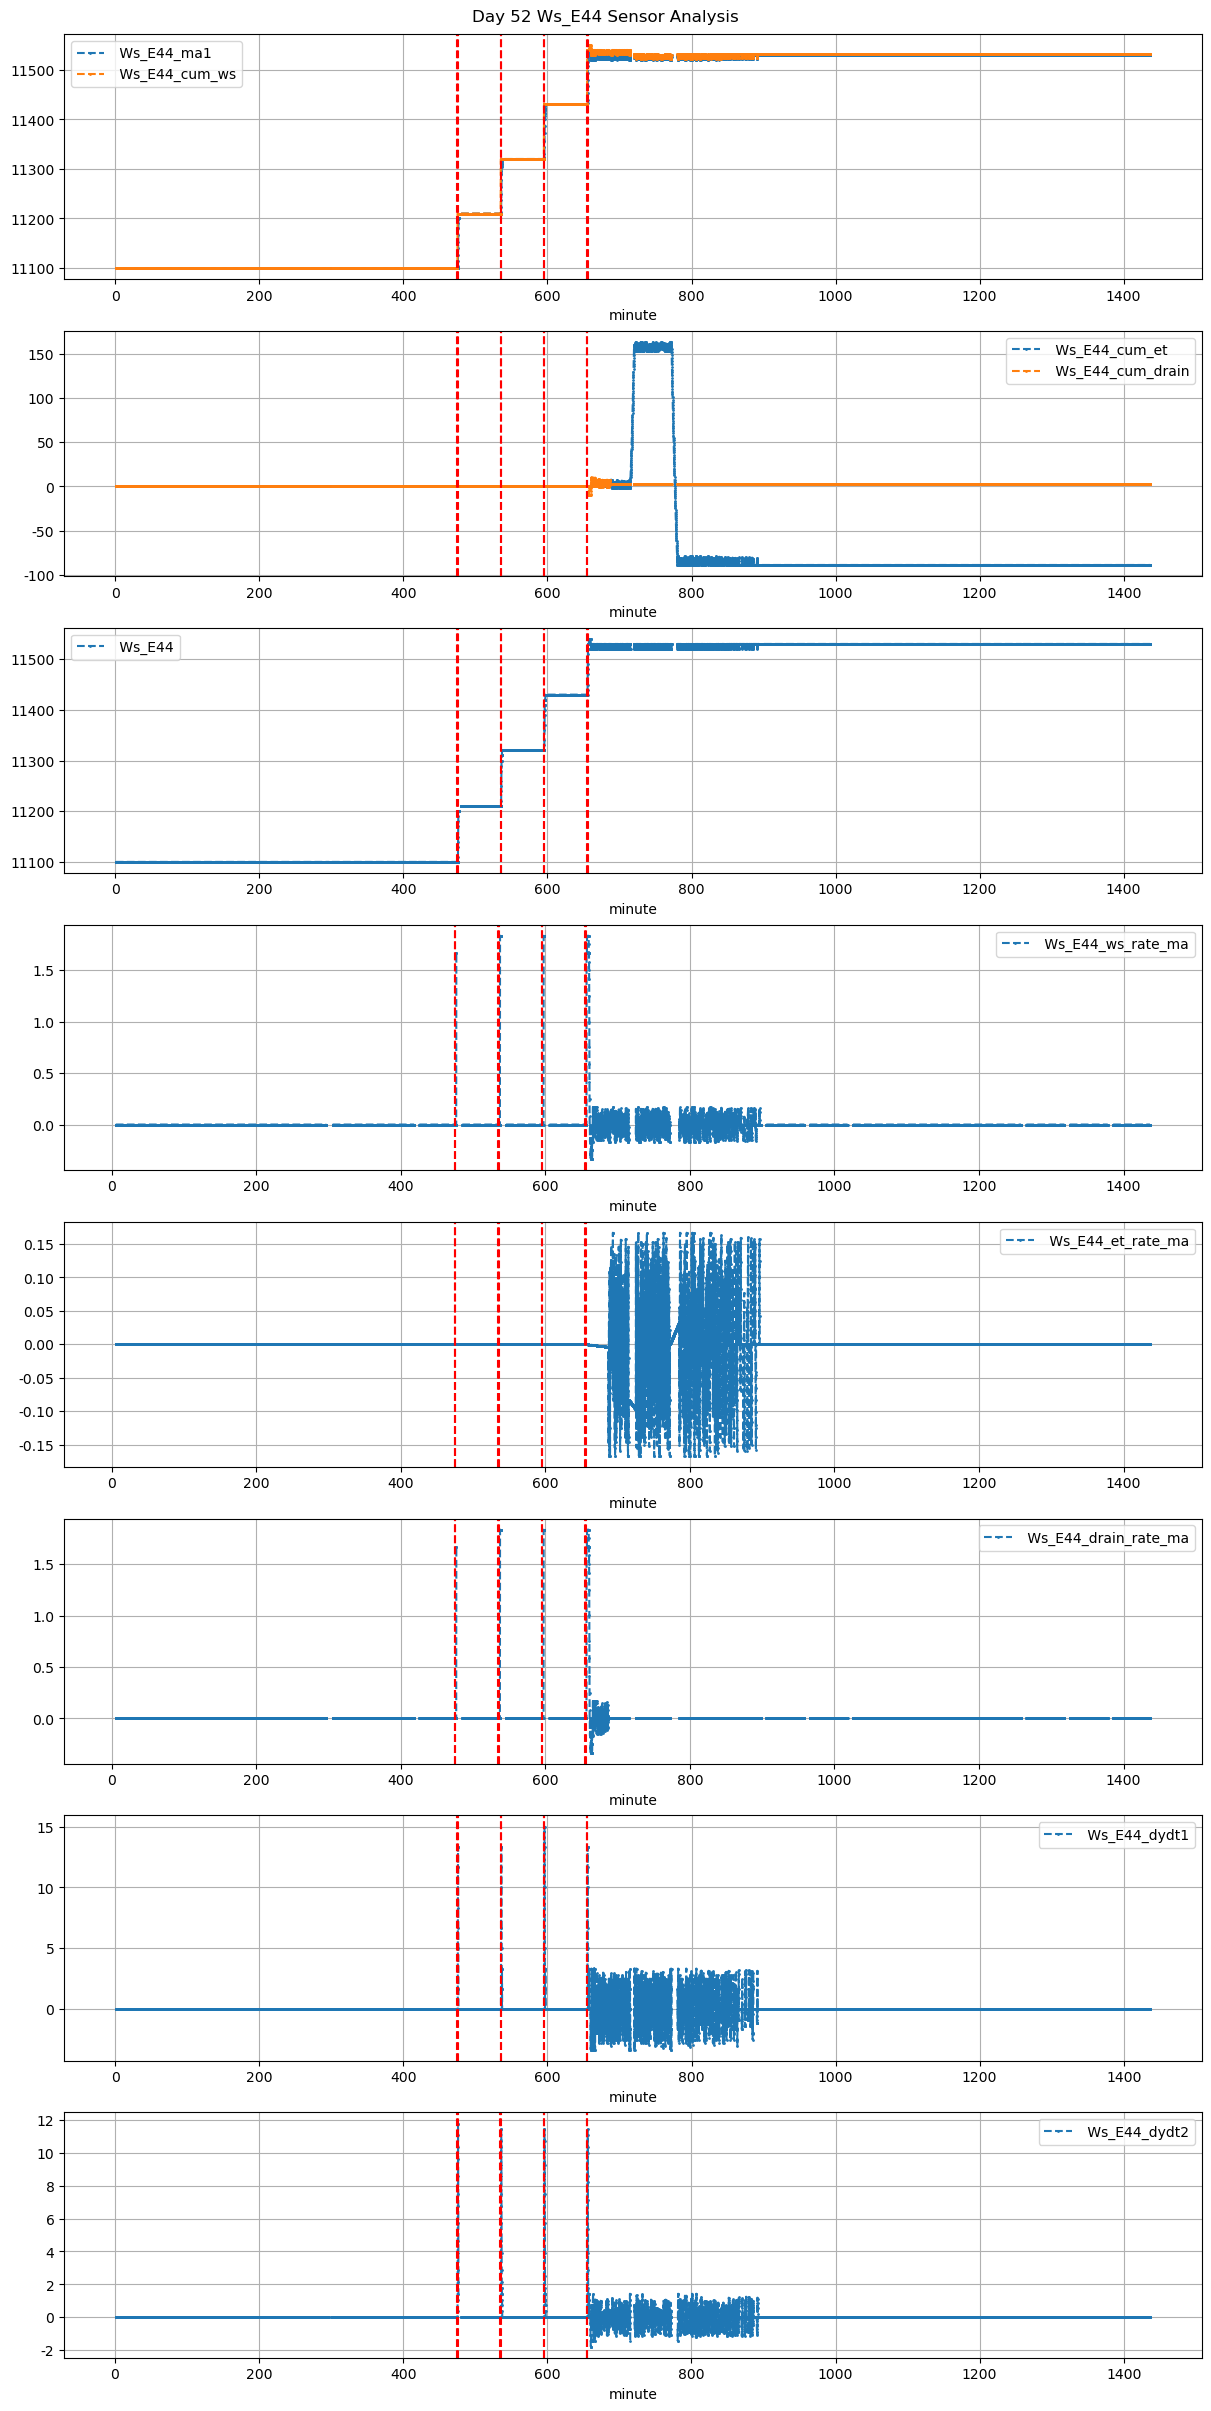
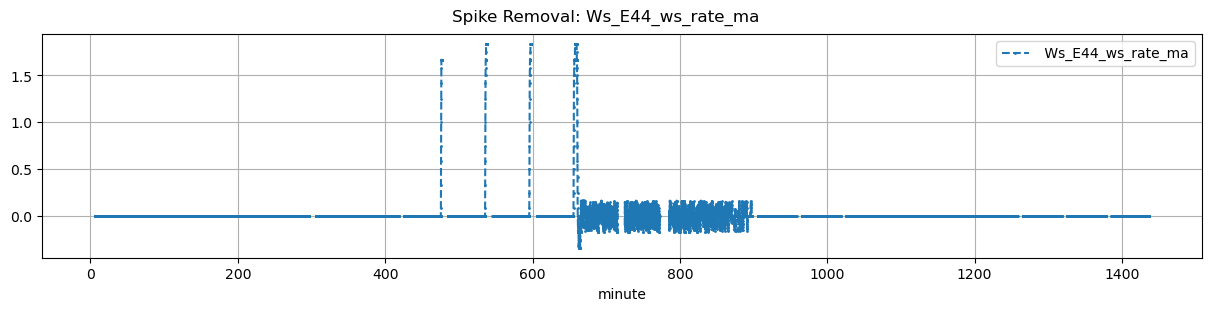
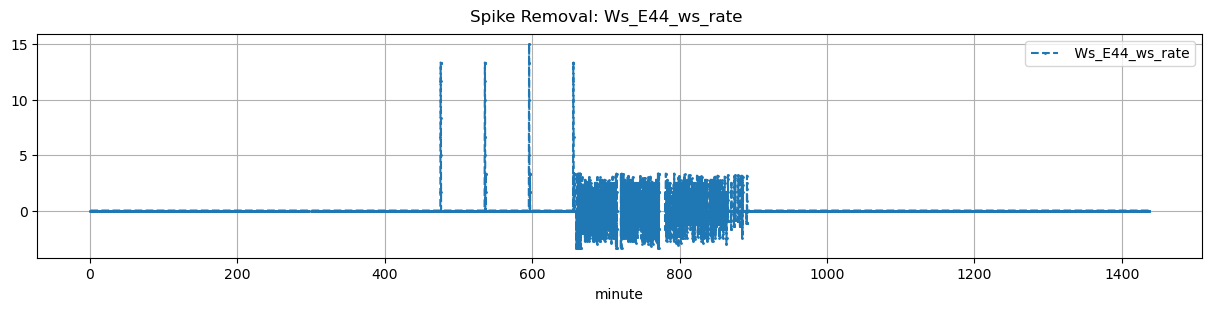
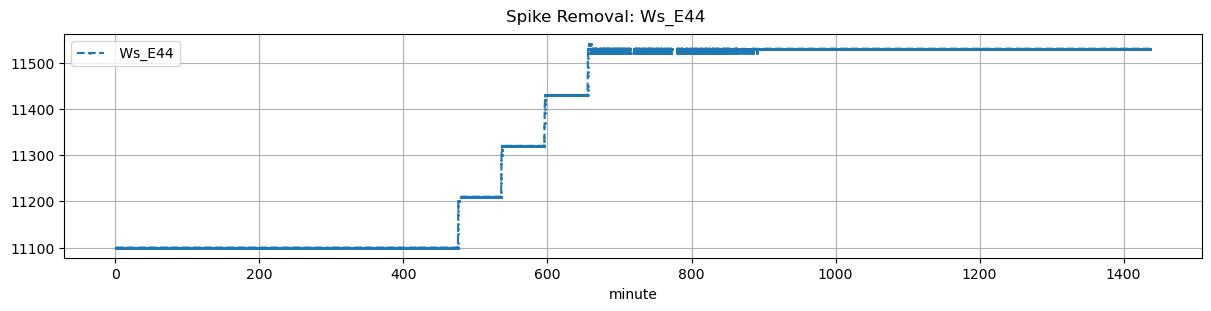
Ws_E44 |
1.678896 |
30 |
475.0 |
475.416667 |
475.58 |
476.666667 |
NaN |
NaN |
NaN |
11100.0 |
11210.0 |
35 |
0.0 |
0.000000 |
0.000000 |
0.414286 |
0.628571 |
22.0 |
25.0 |
65.2 |
22.0 |
0.0 |
0.000000 |
NaN |
0.000000 |
| 2025-11-27 08:55:00+08:00 |
52 |
535 |
Ws_E44 |
1.678896 |
30 |
535.0 |
535.416667 |
535.58 |
537.166667 |
NaN |
NaN |
NaN |
11210.0 |
11320.0 |
35 |
0.0 |
0.000000 |
0.000000 |
0.365714 |
0.628571 |
22.0 |
25.0 |
95.2 |
22.0 |
0.0 |
0.000000 |
NaN |
0.000000 |
| 2025-11-27 09:55:00+08:00 |
52 |
595 |
Ws_E44 |
1.678896 |
30 |
595.0 |
595.416667 |
595.58 |
597.500000 |
NaN |
NaN |
NaN |
11320.0 |
11430.0 |
35 |
0.0 |
0.000000 |
0.000000 |
0.342857 |
0.628571 |
22.0 |
25.0 |
115.2 |
22.0 |
0.0 |
0.000000 |
NaN |
0.000000 |
| 2025-11-27 10:55:00+08:00 |
52 |
655 |
Ws_E44 |
1.678896 |
30 |
655.0 |
655.500000 |
655.58 |
656.916667 |
NaN |
NaN |
NaN |
11430.0 |
11540.0 |
35 |
0.0 |
-0.127778 |
-0.003981 |
0.377143 |
0.628571 |
22.0 |
30.0 |
80.2 |
22.0 |
0.0 |
0.868346 |
NaN |
0.868346 |