| 2025-11-28 08:55:00+08:00 |
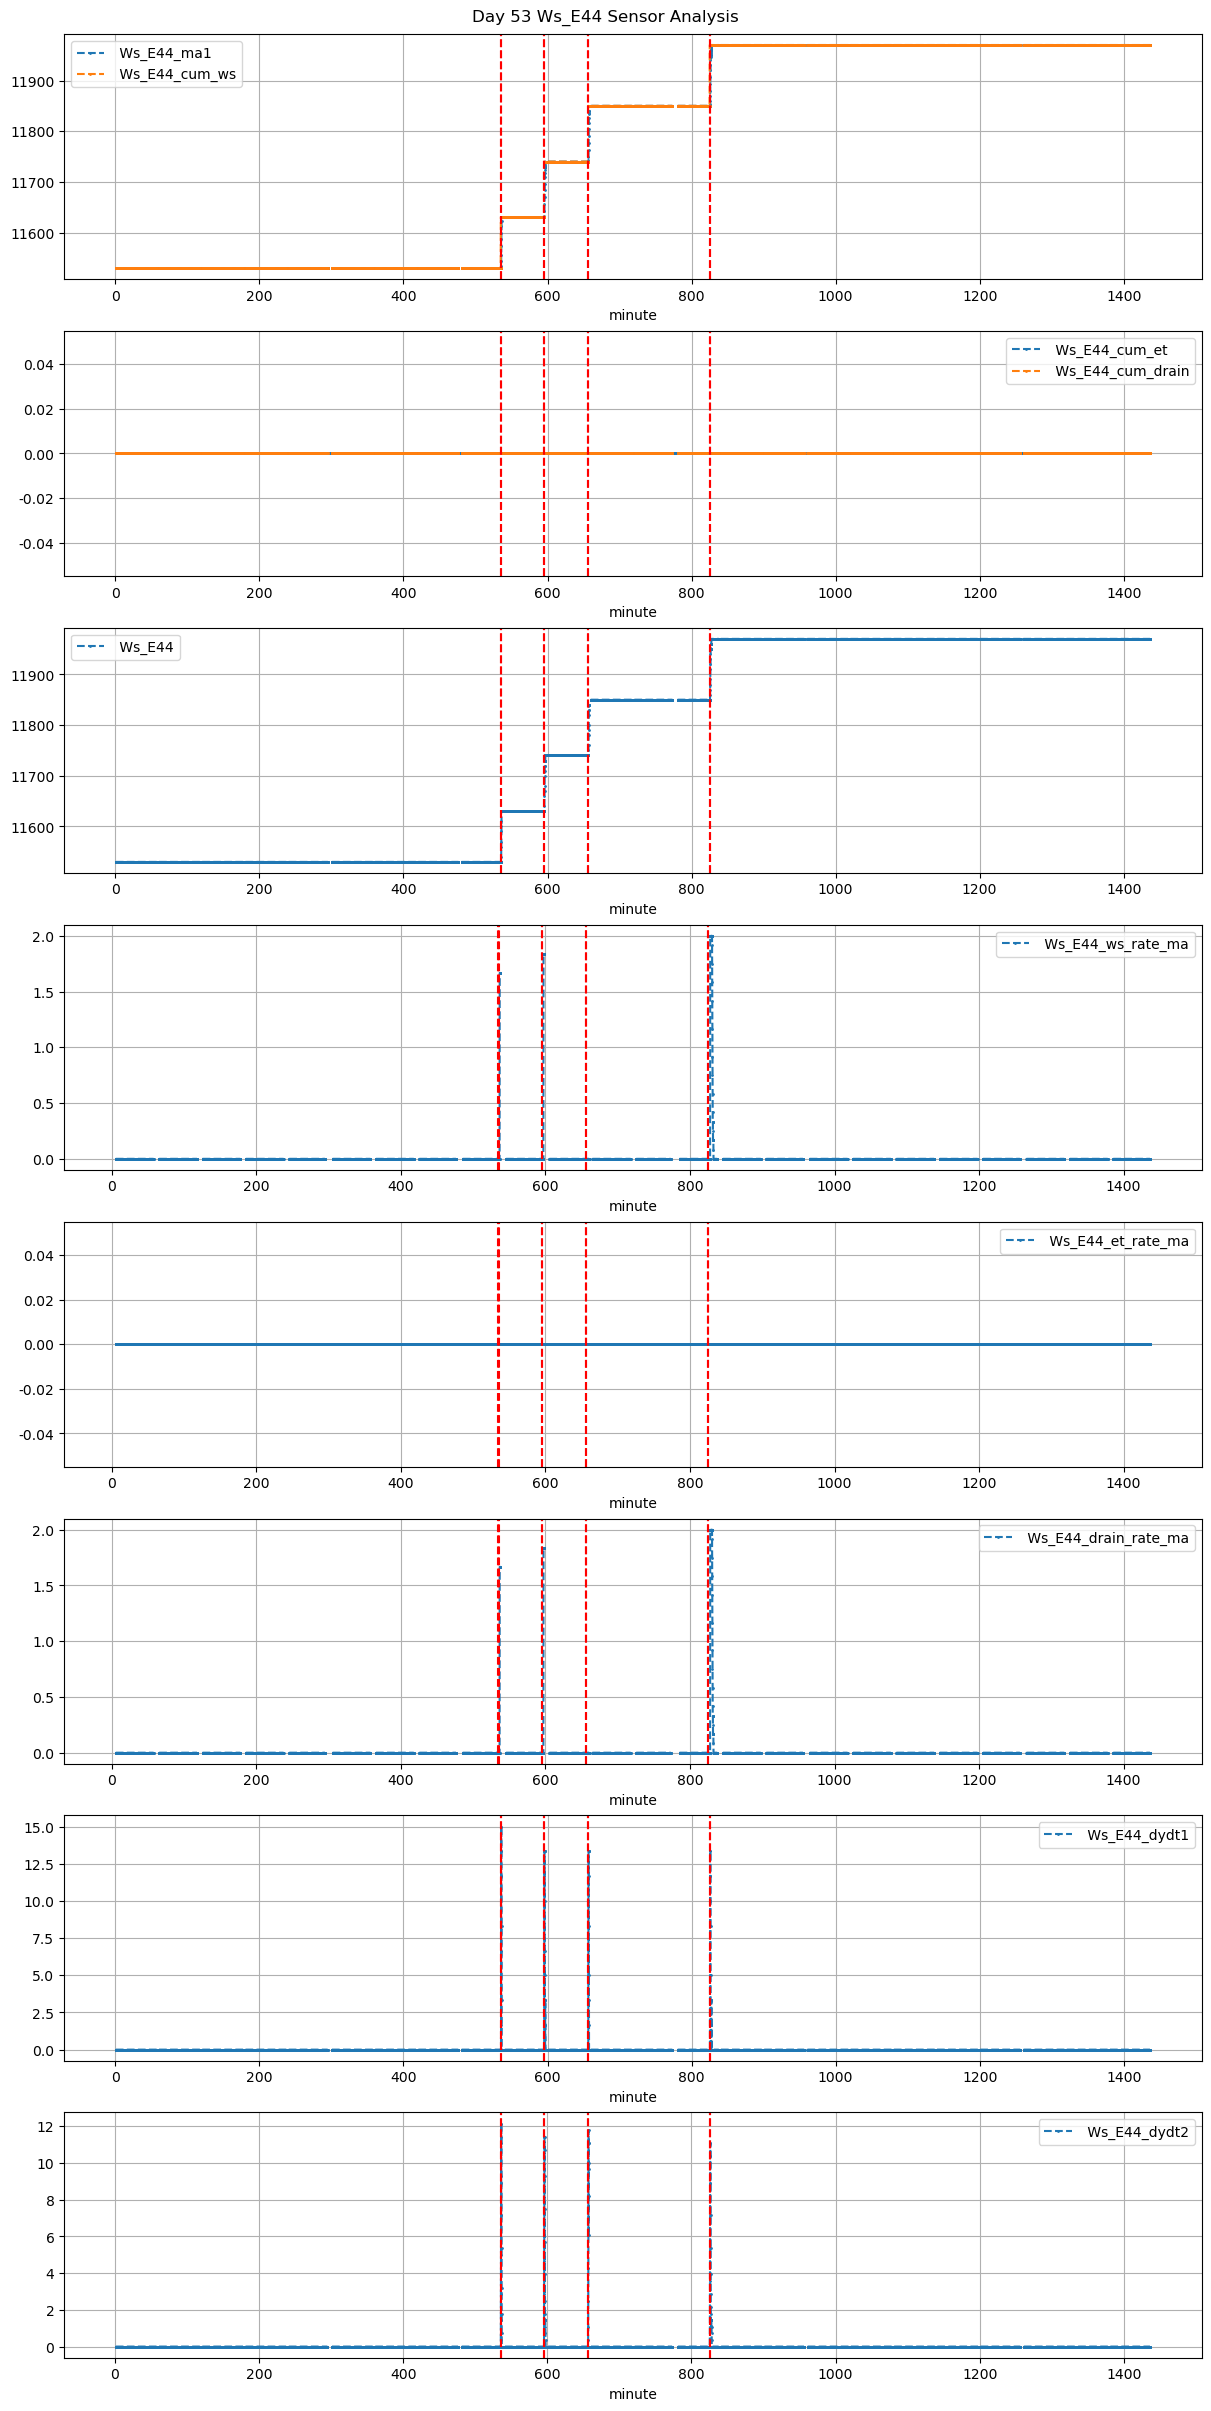
53 |
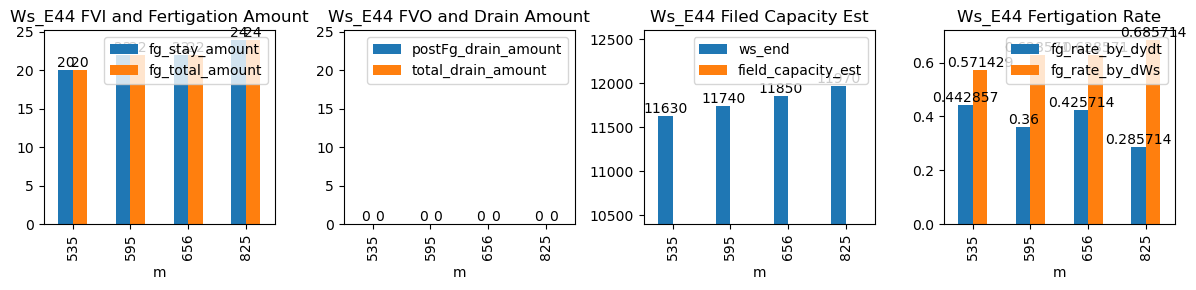
535 |
Ws_E44 |
2.291996 |
30 |
535.0 |
535.416667 |
535.58 |
536.666667 |
NaN |
NaN |
NaN |
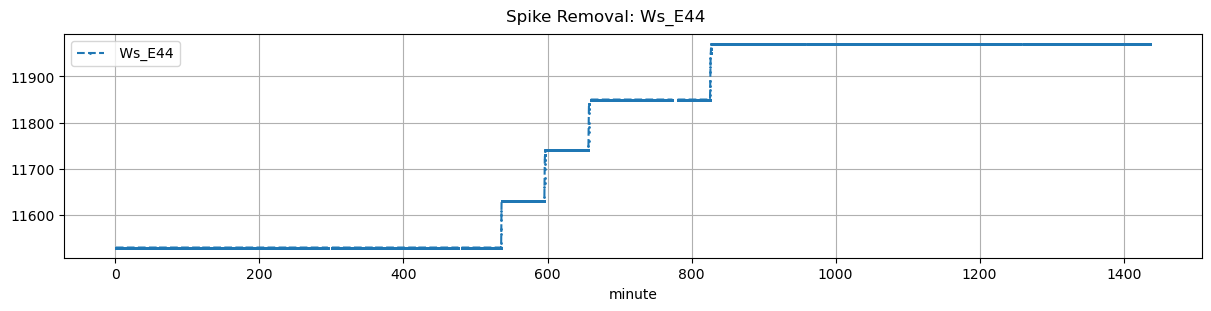
11530.0 |
11630.0 |
35 |
0.0 |
0.0 |
0.0 |
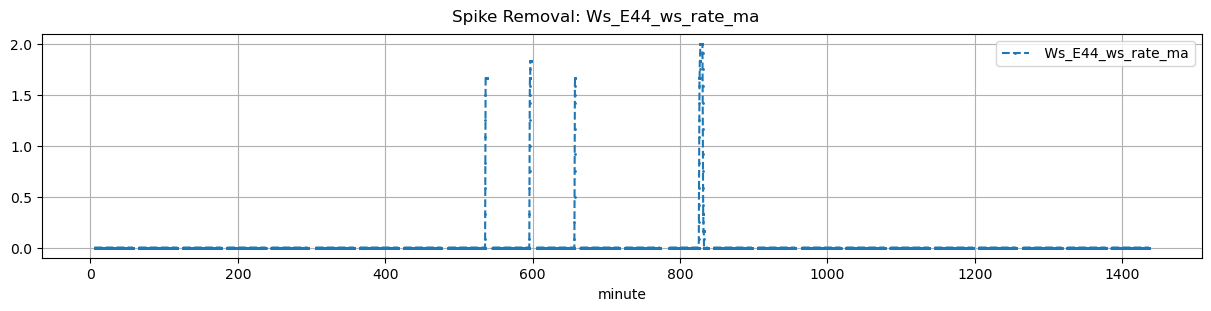
0.442857 |
0.571429 |
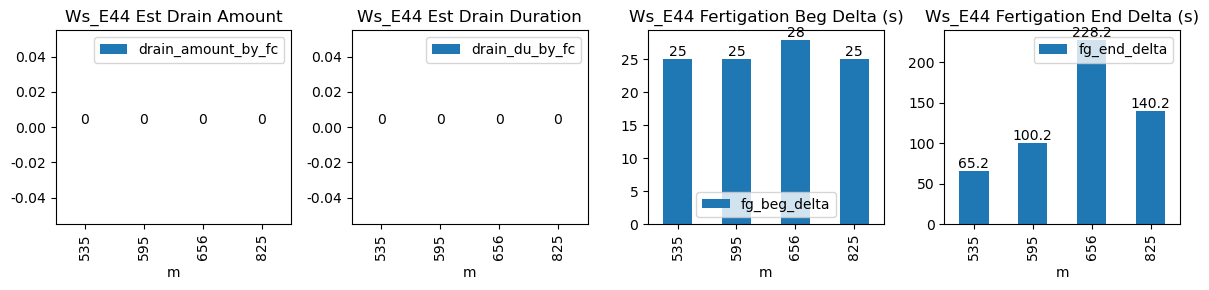
20.0 |
25.0 |
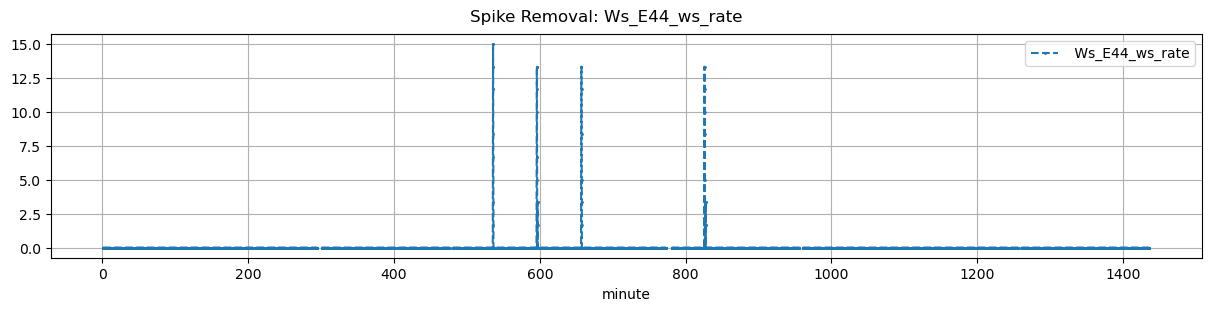
65.2 |
20.0 |
0.0 |
0.0 |
NaN |
0.0 |
| 2025-11-28 09:55:00+08:00 |
53 |
595 |
Ws_E44 |
2.291996 |
30 |
595.0 |
595.416667 |
595.58 |
597.250000 |
NaN |
NaN |
NaN |
11630.0 |
11740.0 |
35 |
0.0 |
0.0 |
0.0 |
0.360000 |
0.628571 |
22.0 |
25.0 |
100.2 |
22.0 |
0.0 |
0.0 |
NaN |
0.0 |
| 2025-11-28 10:56:12+08:00 |
53 |
656 |
Ws_E44 |
2.291996 |
30 |
656.2 |
656.666667 |
656.78 |
660.583333 |
NaN |
NaN |
NaN |
11740.0 |
11850.0 |
35 |
0.0 |
0.0 |
0.0 |
0.425714 |
0.628571 |
22.0 |
28.0 |
228.2 |
22.0 |
0.0 |
0.0 |
NaN |
0.0 |
| 2025-11-28 13:45:00+08:00 |
53 |
825 |
Ws_E44 |
2.291996 |
30 |
825.0 |
825.416667 |
825.58 |
827.916667 |
NaN |
NaN |
NaN |
11850.0 |
11970.0 |
35 |
0.0 |
0.0 |
0.0 |
0.285714 |
0.685714 |
24.0 |
25.0 |
140.2 |
24.0 |
0.0 |
0.0 |
NaN |
0.0 |