| 2025-12-10 10:01:17+08:00 |
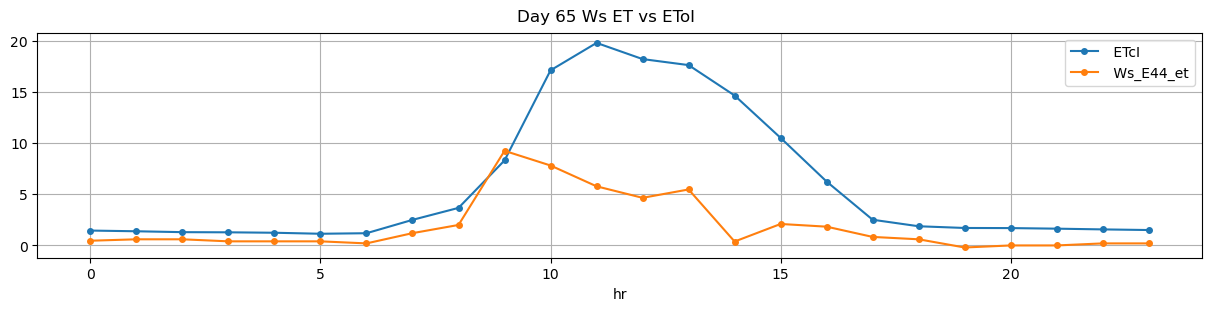
65 |
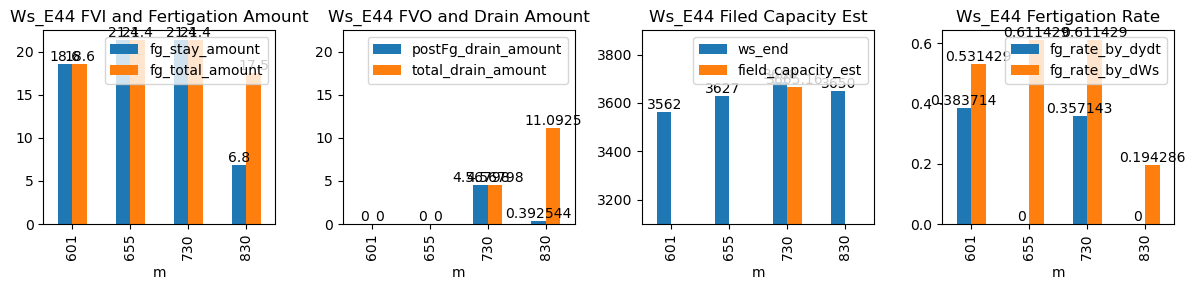
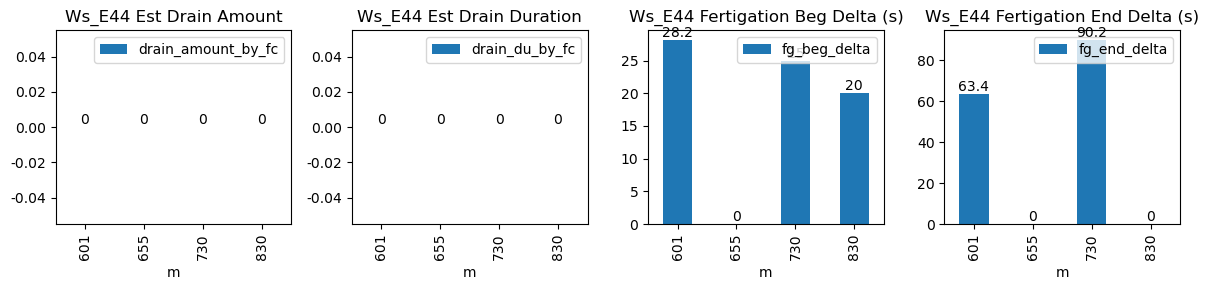
601 |
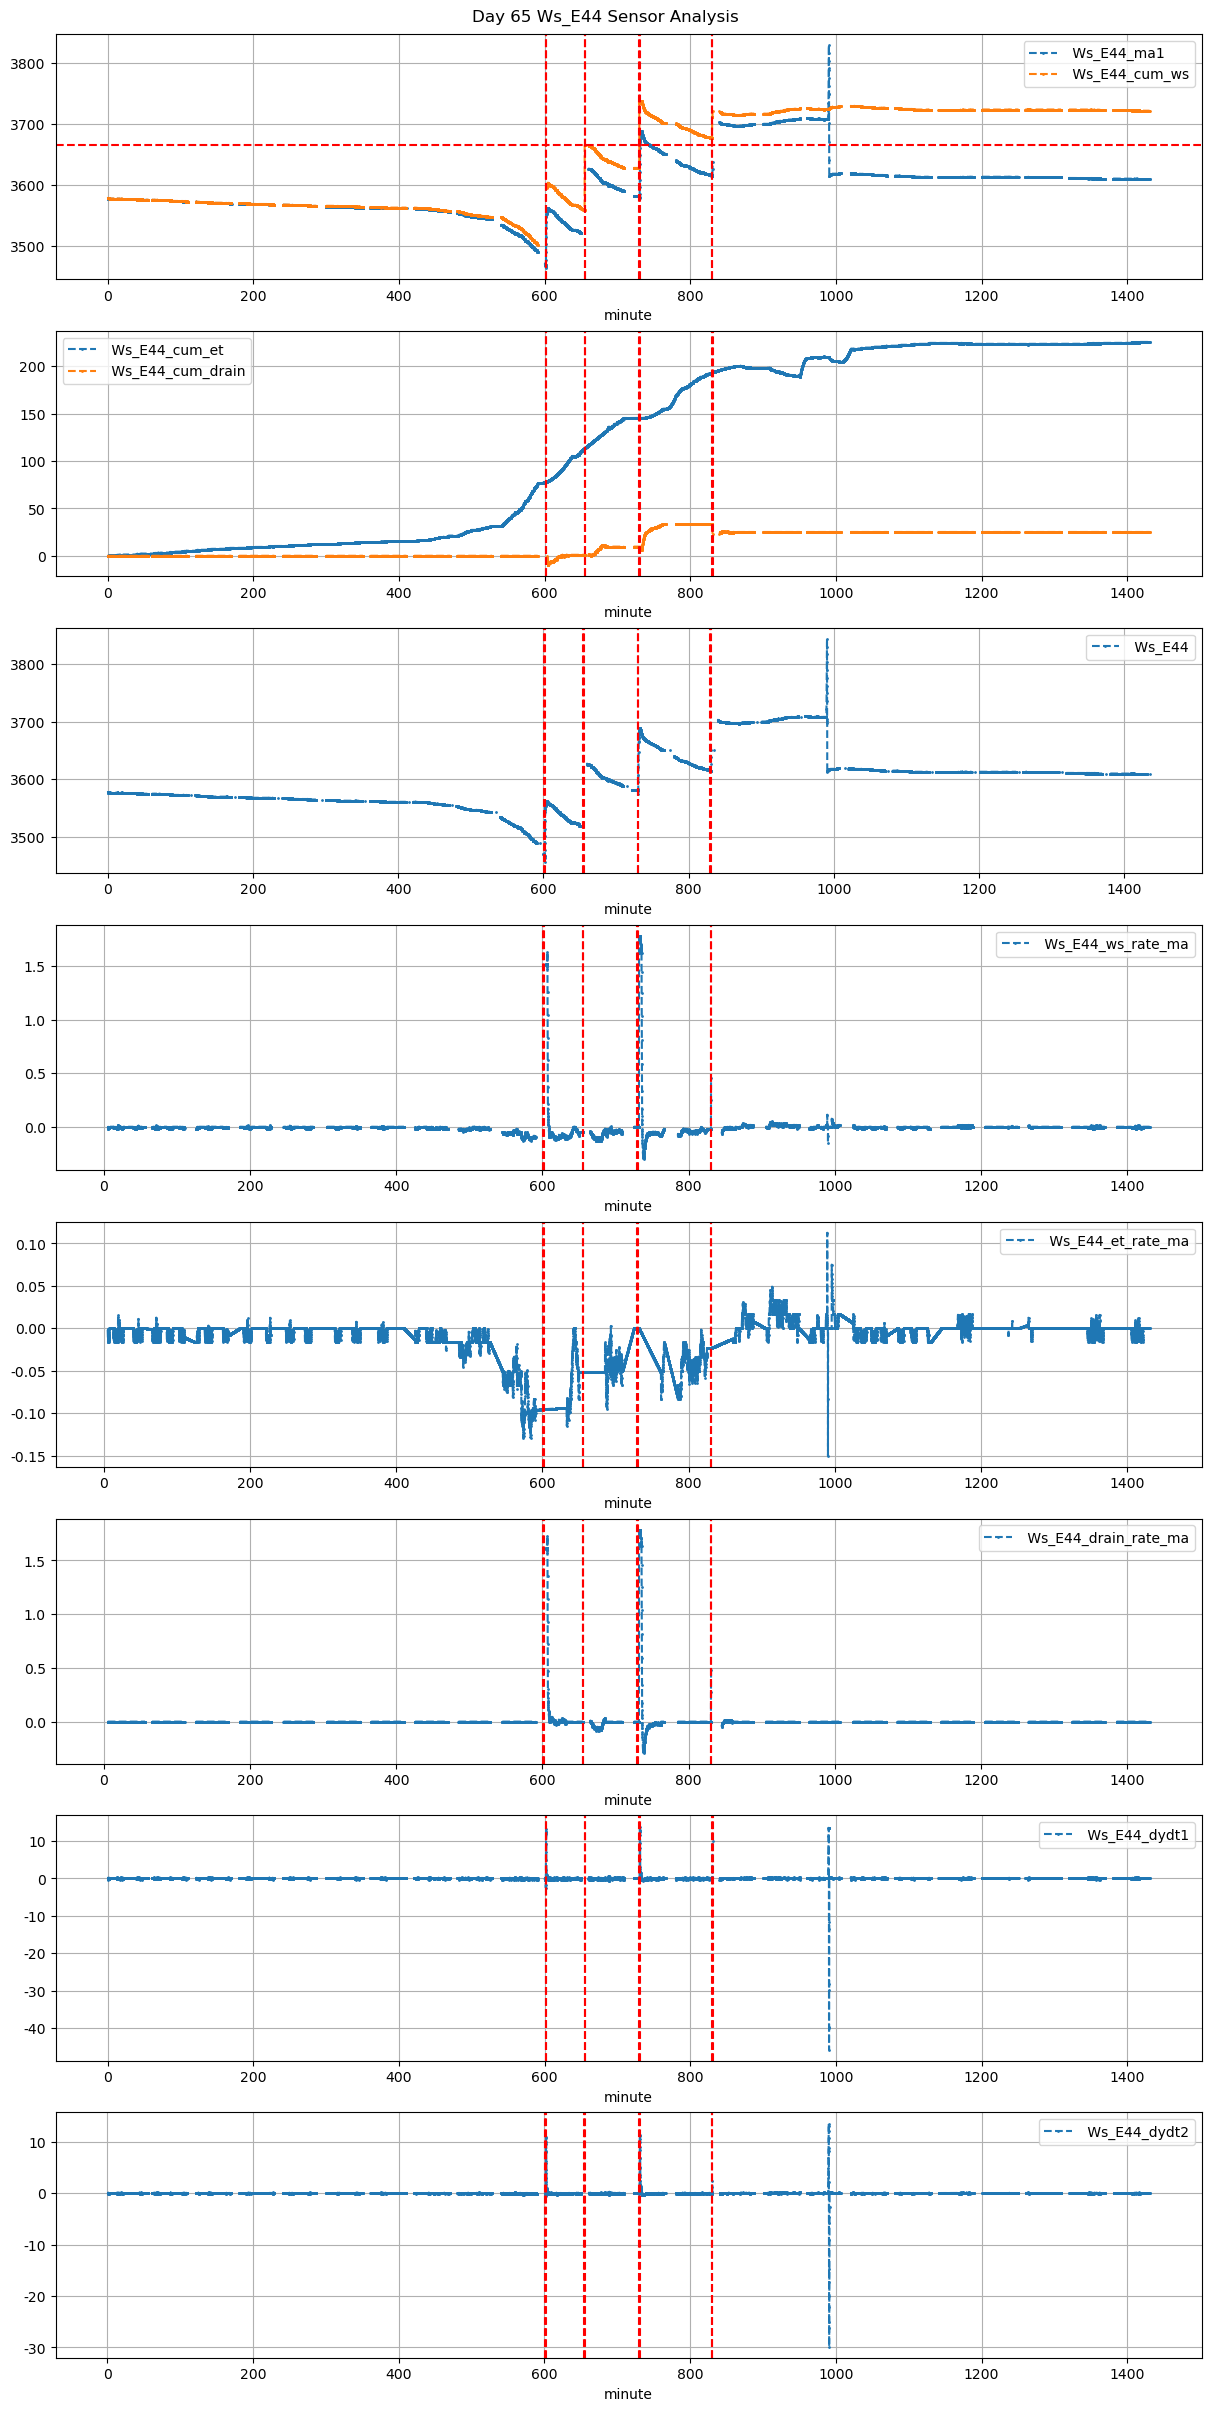
Ws_E44 |
2.730218 |
30 |
601.28 |
601.750000 |
601.86 |
602.916667 |
NaN |
NaN |
NaN |
3469.0 |
3562.0 |
35 |
NaN |
-0.054444 |
-0.093611 |
0.383714 |
0.531429 |
18.6 |
28.2 |
63.4 |
18.6 |
0.0 |
NaN |
NaN |
NaN |
| 2025-12-10 10:55:00+08:00 |
65 |
655 |
Ws_E44 |
2.730218 |
30 |
655.00 |
NaN |
655.58 |
NaN |
NaN |
NaN |
NaN |
3520.0 |
3627.0 |
35 |
-6.649306e-02 |
-0.051667 |
-0.051682 |
NaN |
0.611429 |
21.4 |
NaN |
NaN |
21.4 |
0.0 |
NaN |
NaN |
NaN |
| 2025-12-10 12:10:00+08:00 |
65 |
730 |
Ws_E44 |
2.730218 |
30 |
730.00 |
730.416667 |
730.58 |
732.083333 |
NaN |
NaN |
NaN |
3581.0 |
3688.0 |
35 |
-1.299278e-14 |
-0.205694 |
-0.052118 |
0.357143 |
0.611429 |
21.4 |
25.0 |
90.2 |
21.4 |
0.0 |
4.567976 |
3665.160119 |
4.567976 |
| 2025-12-10 13:50:00+08:00 |
65 |
830 |
Ws_E44 |
2.730218 |
30 |
830.00 |
830.333333 |
830.58 |
NaN |
NaN |
NaN |
NaN |
3616.0 |
3650.0 |
35 |
-2.331685e-02 |
NaN |
-0.011944 |
NaN |
0.194286 |
6.8 |
20.0 |
NaN |
17.5 |
10.7 |
0.392544 |
NaN |
11.092544 |