| 2025-12-11 09:11:16+08:00 |
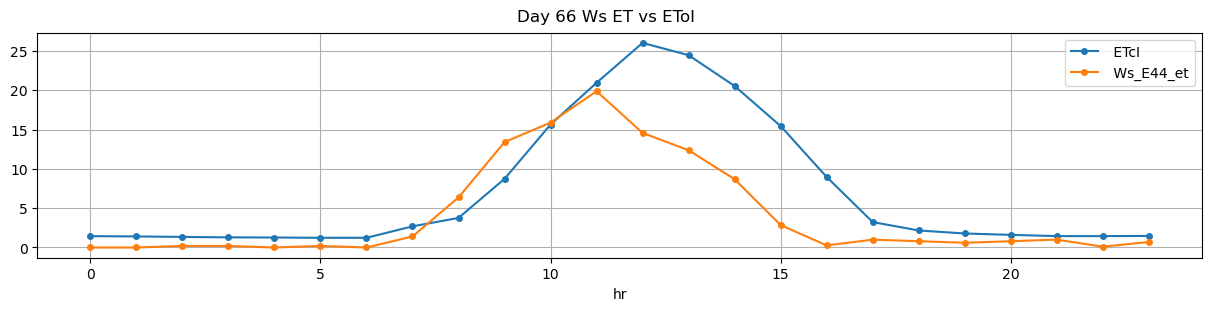
66 |
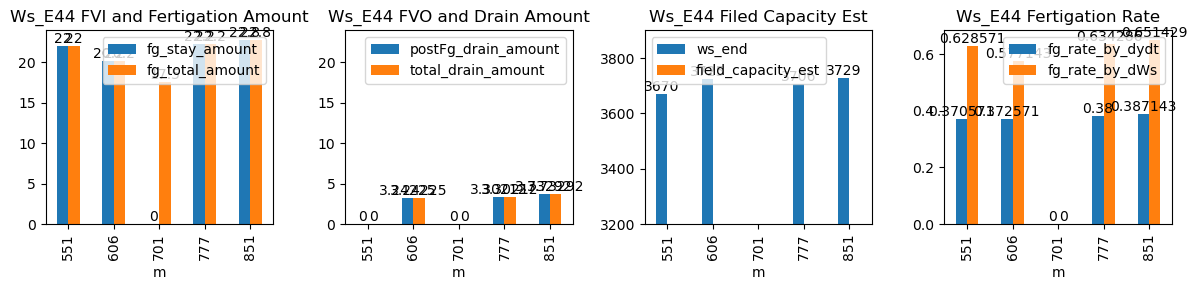
551 |
Ws_E44 |
0.366177 |
30 |
551.27 |
551.583333 |
551.85 |
553.166667 |
NaN |
NaN |
NaN |
3560.0 |
3670.0 |
35 |
NaN |
-0.095833 |
-0.049236 |
0.370571 |
0.628571 |
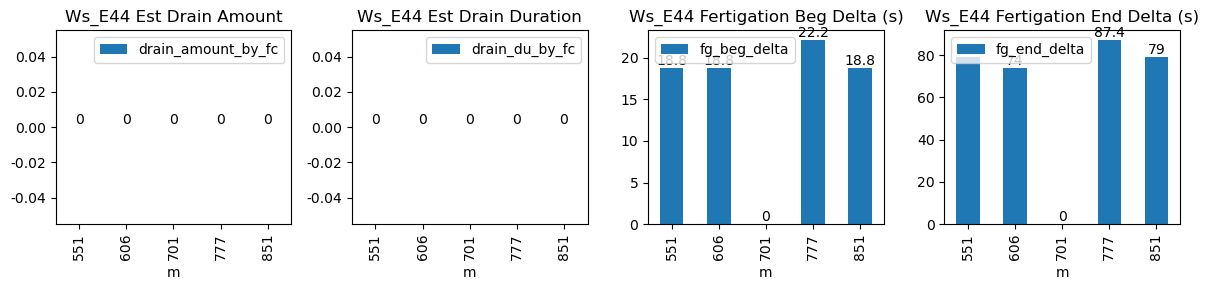
22.0 |
18.8 |
79.0 |
22.0 |
0.0 |
NaN |
NaN |
NaN |
| 2025-12-11 10:06:16+08:00 |
66 |
606 |
Ws_E44 |
0.366177 |
30 |
606.27 |
606.583333 |
606.85 |
608.083333 |
NaN |
NaN |
NaN |
3624.0 |
3725.0 |
35 |
-0.145902 |
-0.318750 |
-0.071129 |
0.372571 |
0.577143 |
20.2 |
18.8 |
74.0 |
20.2 |
0.0 |
3.242247 |
NaN |
3.242247 |
| 2025-12-11 11:41:16+08:00 |
66 |
701 |
Ws_E44 |
0.366177 |
30 |
701.27 |
NaN |
701.85 |
NaN |
NaN |
NaN |
NaN |
NaN |
NaN |
35 |
NaN |
NaN |
-0.107153 |
NaN |
NaN |
NaN |
NaN |
NaN |
17.5 |
NaN |
NaN |
NaN |
NaN |
| 2025-12-11 12:57:23+08:00 |
66 |
777 |
Ws_E44 |
0.366177 |
30 |
777.38 |
777.750000 |
777.96 |
779.416667 |
NaN |
NaN |
NaN |
3595.0 |
3706.0 |
35 |
-0.092194 |
-0.310972 |
-0.076290 |
0.380000 |
0.634286 |
22.2 |
22.2 |
87.4 |
22.2 |
0.0 |
3.302119 |
NaN |
3.302119 |
| 2025-12-11 14:11:16+08:00 |
66 |
851 |
Ws_E44 |
0.366177 |
30 |
851.27 |
851.583333 |
851.85 |
853.166667 |
NaN |
NaN |
NaN |
3615.0 |
3729.0 |
35 |
-0.067361 |
-0.282083 |
-0.052164 |
0.387143 |
0.651429 |
22.8 |
18.8 |
79.0 |
22.8 |
0.0 |
3.732916 |
NaN |
3.732916 |