| 2025-12-12 09:10:00+08:00 |
67 |
550 |
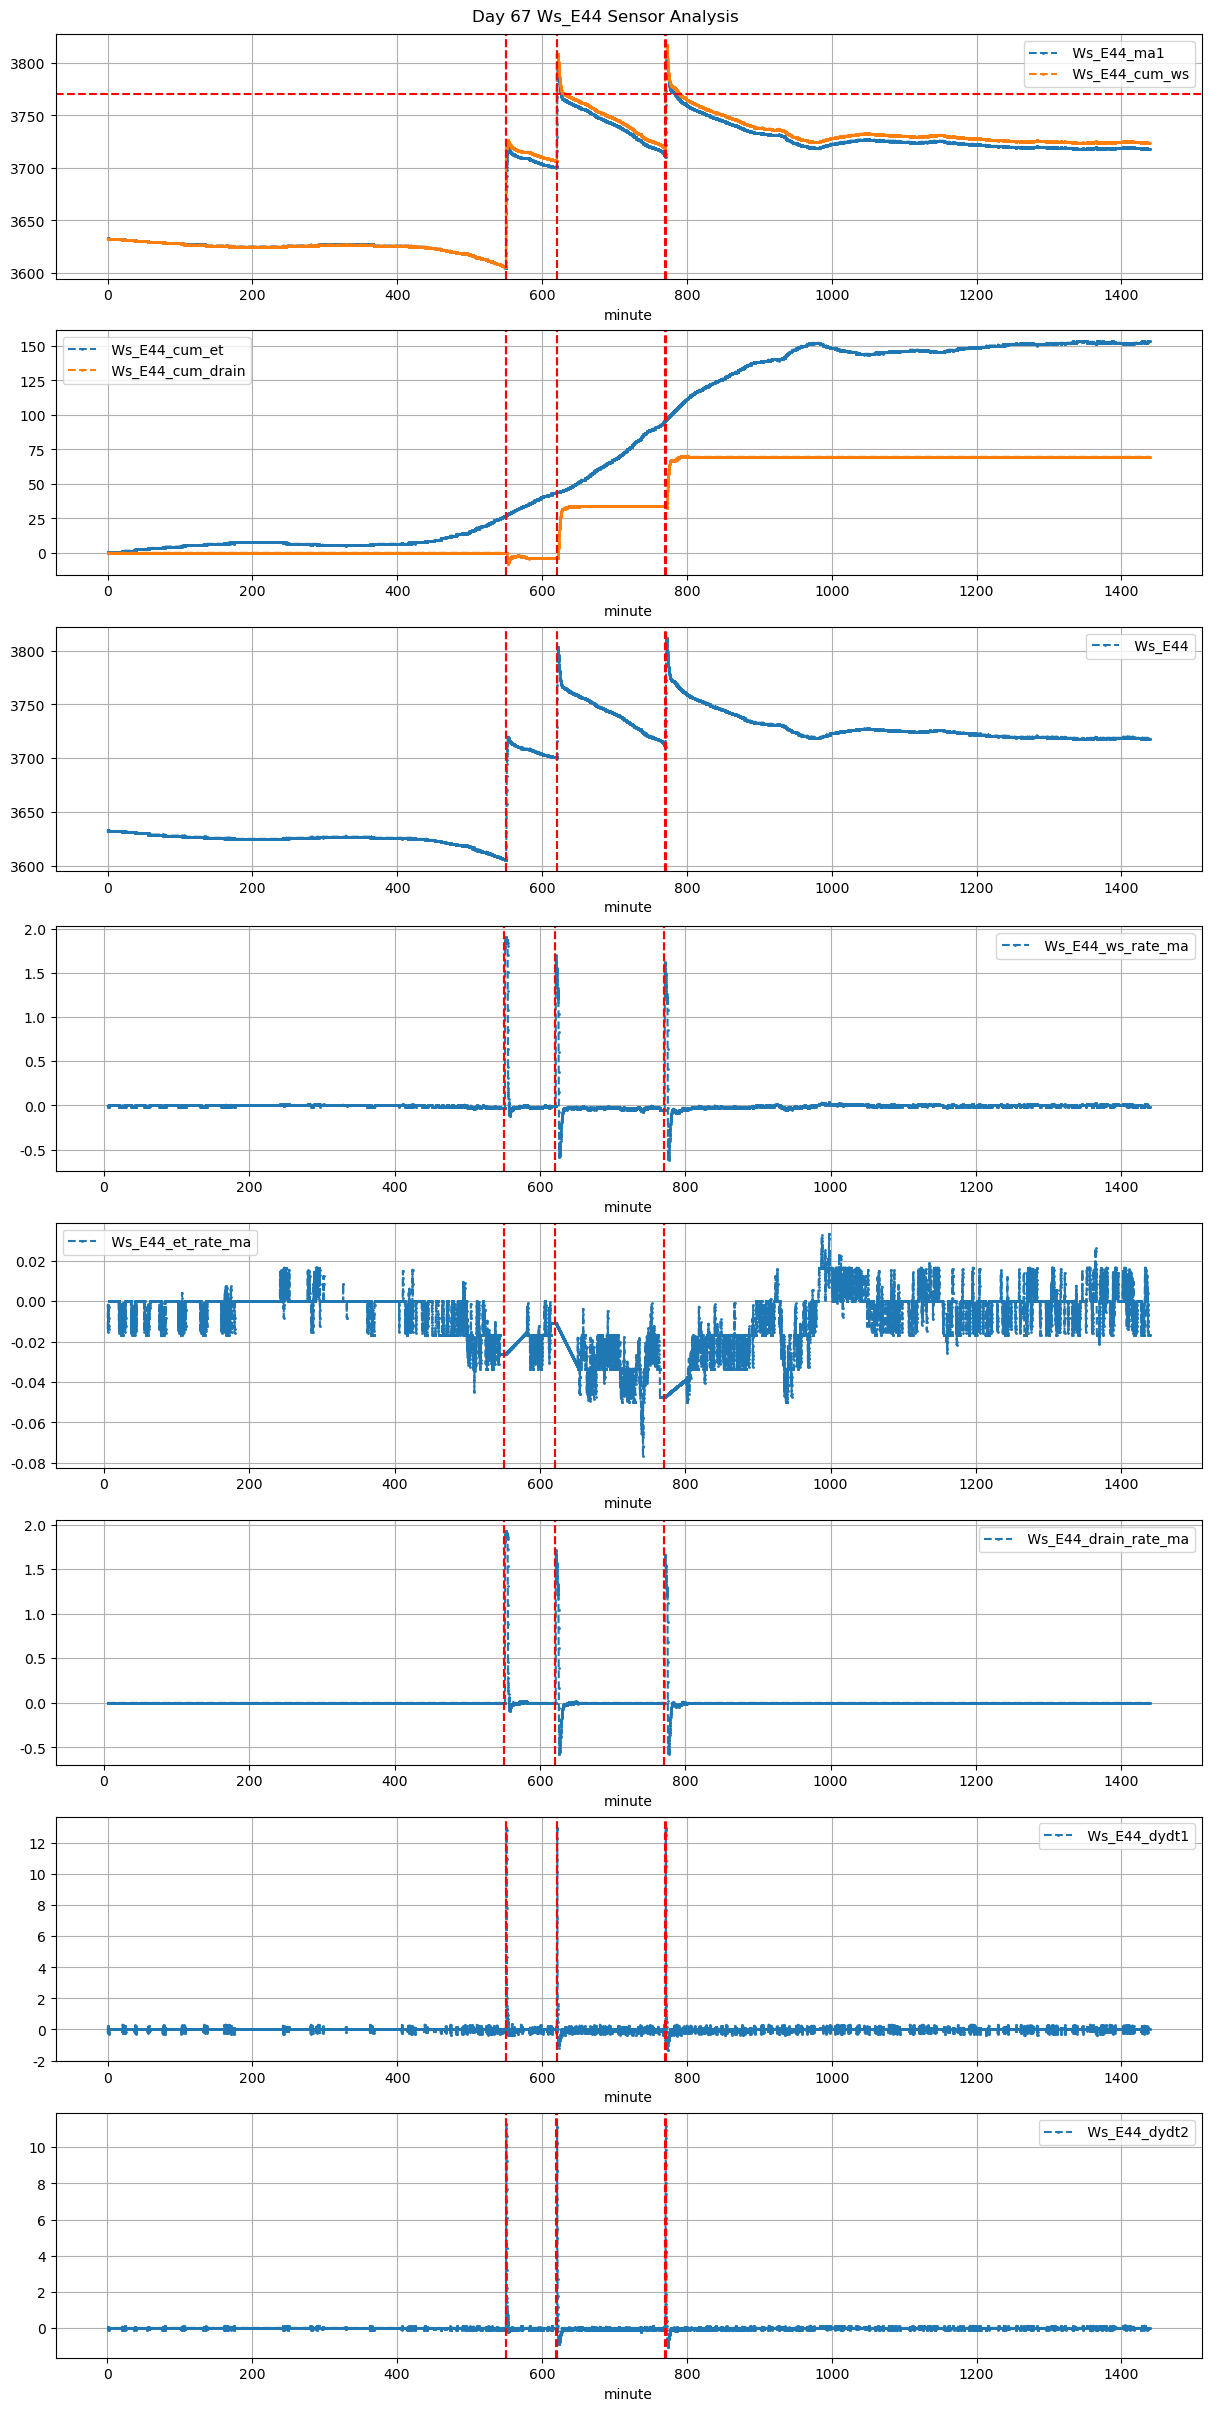
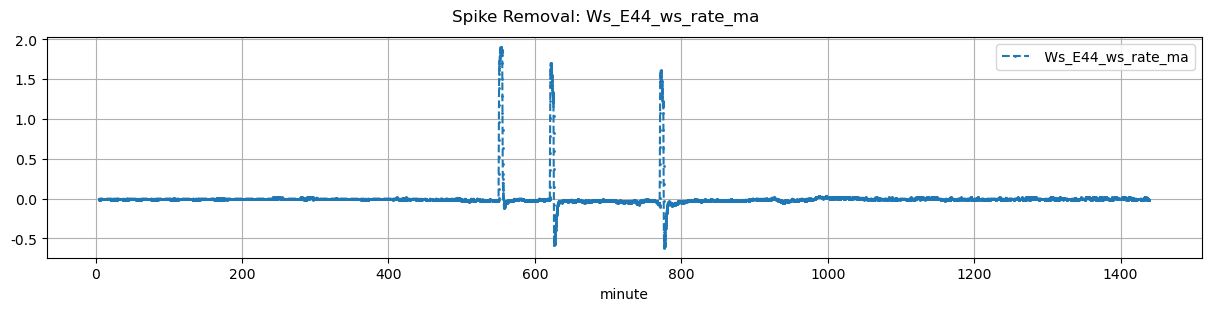
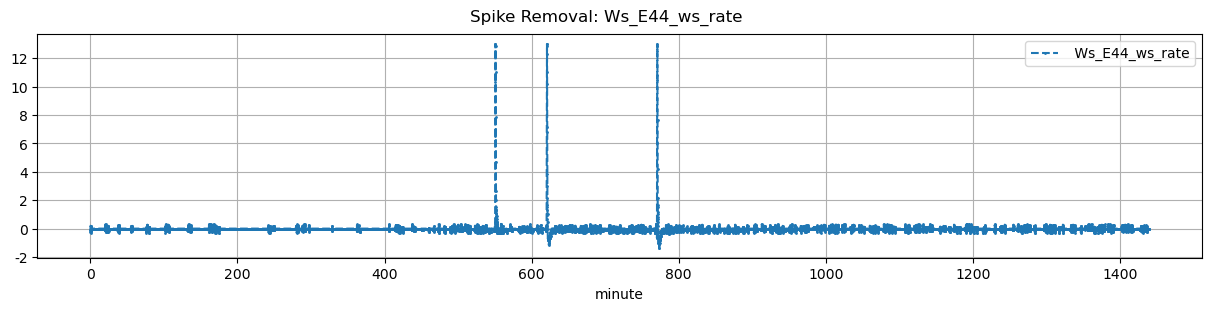
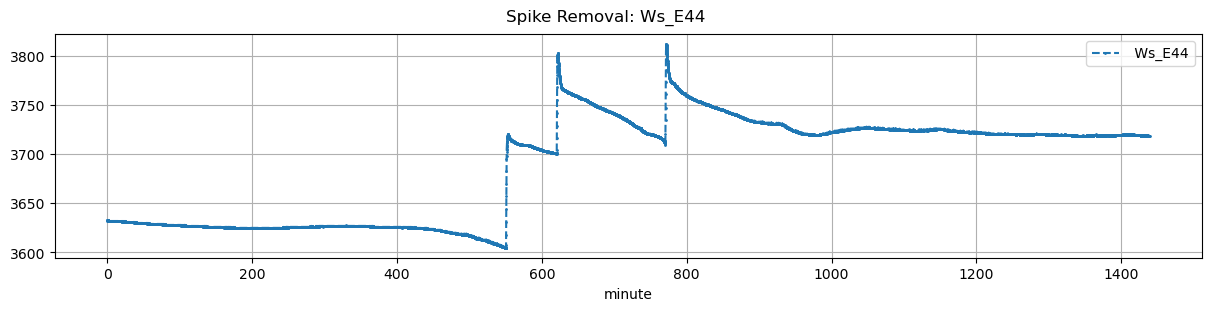
Ws_E44 |
0.319541 |
30 |
550.0 |
550.333333 |
550.58 |
551.916667 |
NaN |
NaN |
NaN |
3606.0 |
3720.0 |
35 |
-0.026236 |
-0.059028 |
-0.015278 |
0.376571 |
0.651429 |
22.8 |
20.0 |
80.2 |
22.8 |
0.0 |
-0.781263 |
NaN |
-0.781263 |
| 2025-12-12 10:20:00+08:00 |
67 |
620 |
Ws_E44 |
0.319541 |
30 |
620.0 |
620.333333 |
620.58 |
621.750000 |
NaN |
NaN |
NaN |
3701.0 |
3803.0 |
35 |
-0.010734 |
-0.285833 |
-0.032389 |
0.386000 |
0.582857 |
20.4 |
20.0 |
70.2 |
20.4 |
0.0 |
7.497345 |
3765.513273 |
7.497345 |
| 2025-12-12 12:50:00+08:00 |
67 |
770 |
Ws_E44 |
0.319541 |
30 |
770.0 |
770.416667 |
770.58 |
771.750000 |
NaN |
NaN |
NaN |
3714.0 |
3812.0 |
35 |
-0.047316 |
-0.303611 |
-0.038438 |
0.387714 |
0.560000 |
19.6 |
25.0 |
70.2 |
19.6 |
0.0 |
7.179912 |
3776.100440 |
7.179912 |