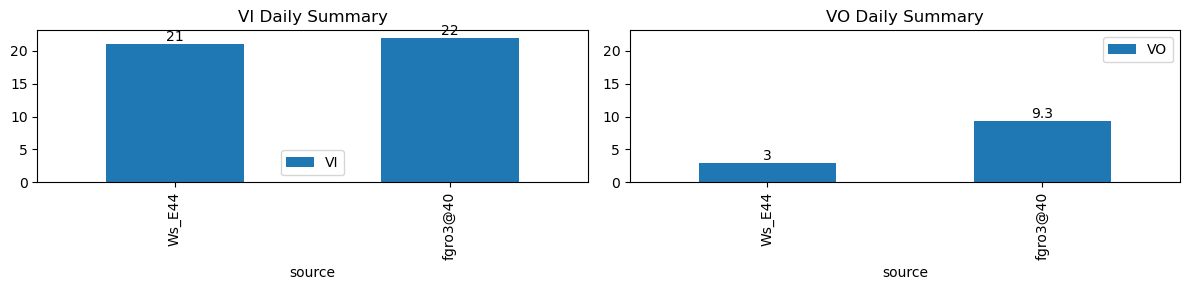
VI and VO Daily Summary
| ws_name | total_dp | nan_dp | nan_filled_dp | long_gap_dp | num_spike |
|---|---|---|---|---|---|
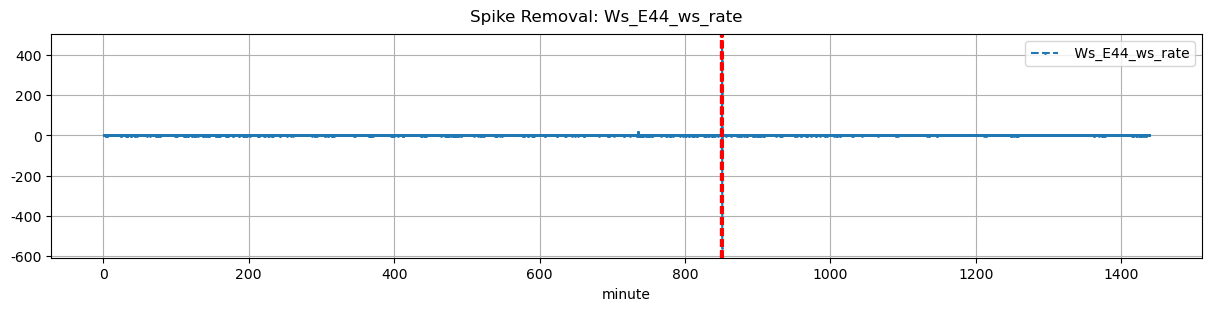
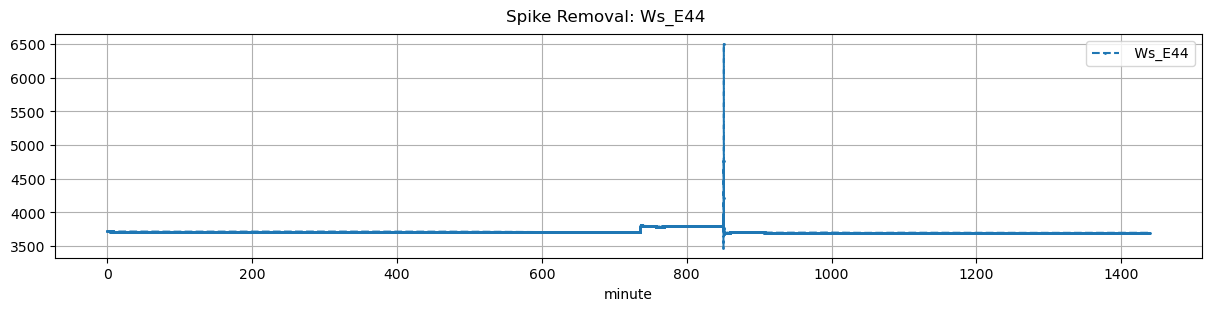
| Ws_E44 | 17270 | 0 | 14434 | 0 | 0 |
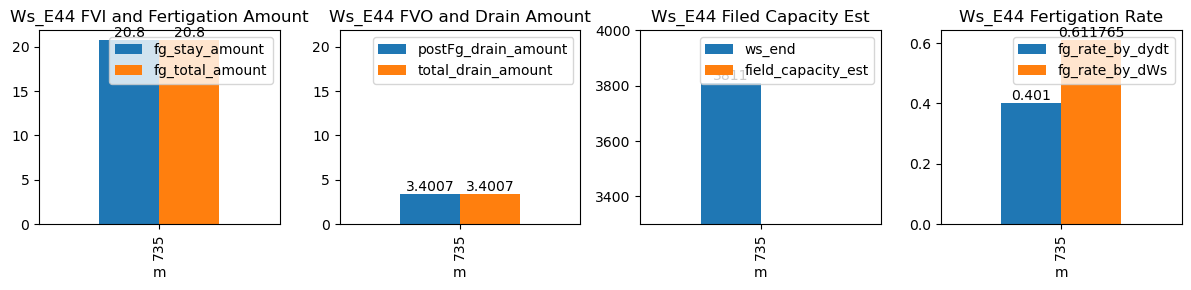
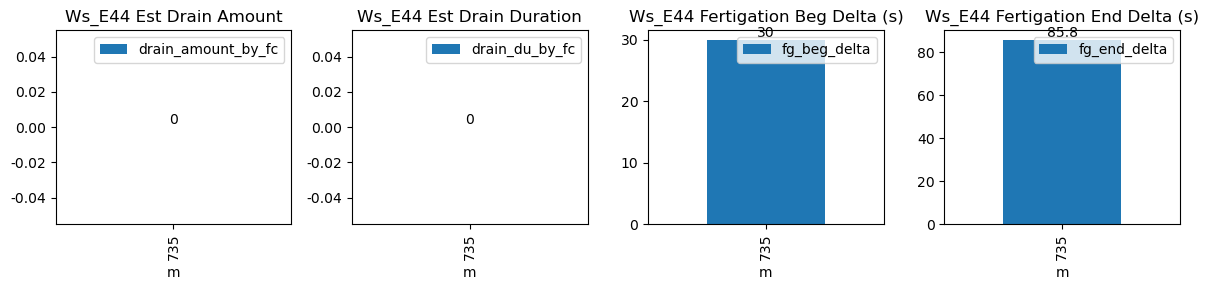
| ds | d | m | ws_name | prominence_cut | max_drain_du | fg_beg | fg_beg_est | fg_end | fg_end_est | drain_amount_by_fc | drain_du_by_fc | drain_rate_by_fc | ws_beg | ws_end | duc | pre_fg_et | post_fg_ws | post_drn_et | fg_rate_by_dydt | fg_rate_by_dWs | fg_stay_amount | fg_beg_delta | fg_end_delta | fg_total_amount | fg_drain_amount | postFg_drain_amount | field_capacity_est | total_drain_amount |
|---|---|---|---|---|---|---|---|---|---|---|---|---|---|---|---|---|---|---|---|---|---|---|---|---|---|---|---|---|
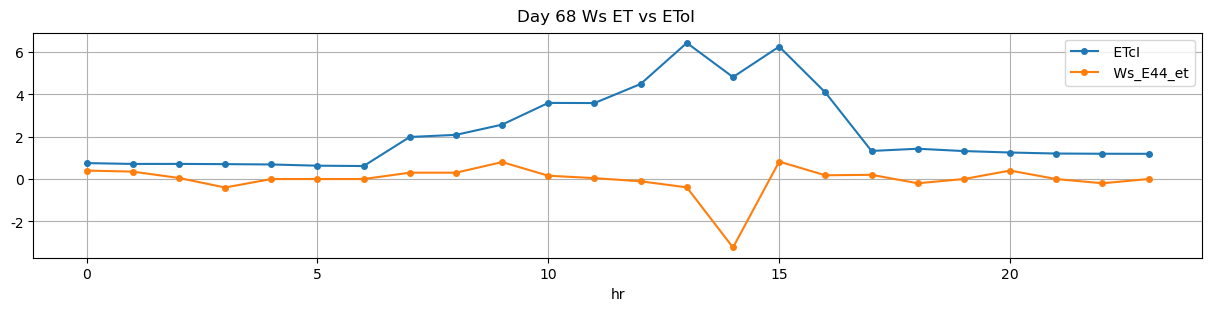
| 2025-12-13 12:15:00+08:00 | 68 | 735 | Ws_E44 | 13.104493 | 30 | 735.0 | 735.5 | 735.57 | 737.0 | NaN | NaN | NaN | 3707.0 | 3811.0 | 34 | -0.001836 | -0.107639 | 0.0 | 0.401 | 0.611765 | 20.8 | 30.0 | 85.8 | 20.8 | 0.0 | 3.400703 | NaN | 3.400703 |