| 2025-12-14 10:00:00+08:00 |
69 |
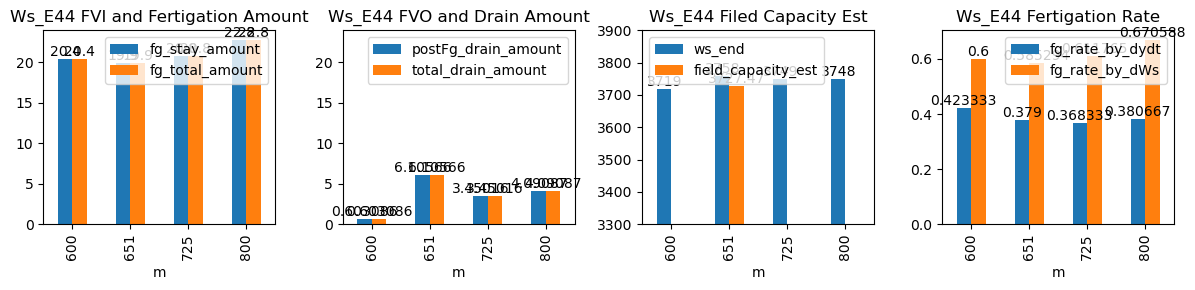
600 |
Ws_E44 |
0.382938 |
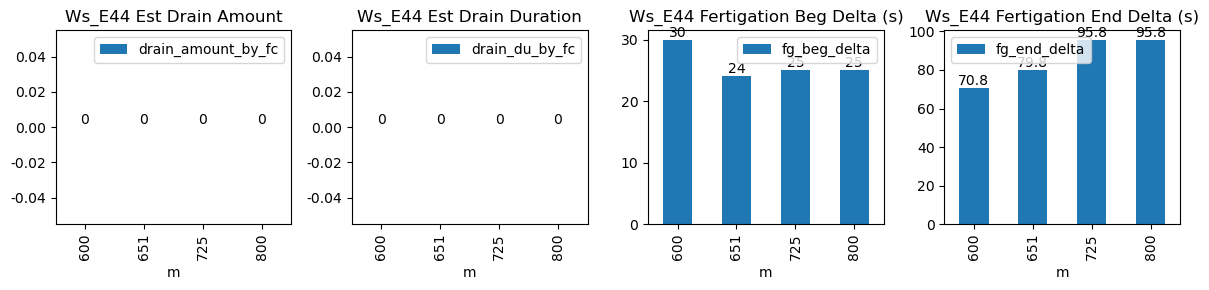
30 |
600.0 |
600.500000 |
600.57 |
601.750000 |
NaN |
NaN |
NaN |
3617.0 |
3719.0 |
34 |
-0.077530 |
-0.167500 |
-0.104924 |
0.423333 |
0.600000 |
20.4 |
30.0 |
70.8 |
20.4 |
0.0 |
0.603086 |
NaN |
0.603086 |
| 2025-12-14 10:51:06+08:00 |
69 |
651 |
Ws_E44 |
0.382938 |
30 |
651.1 |
651.500000 |
651.67 |
653.000000 |
NaN |
NaN |
NaN |
3658.5 |
3758.0 |
34 |
-0.092662 |
-0.349722 |
-0.086111 |
0.379000 |
0.585294 |
19.9 |
24.0 |
79.8 |
19.9 |
0.0 |
6.105659 |
3727.471706 |
6.105659 |
| 2025-12-14 12:05:00+08:00 |
69 |
725 |
Ws_E44 |
0.382938 |
30 |
725.0 |
725.416667 |
725.57 |
727.166667 |
NaN |
NaN |
NaN |
3645.0 |
3749.0 |
34 |
-0.108475 |
-0.302083 |
-0.130799 |
0.368333 |
0.611765 |
20.8 |
25.0 |
95.8 |
20.8 |
0.0 |
3.450163 |
NaN |
3.450163 |
| 2025-12-14 13:20:00+08:00 |
69 |
800 |
Ws_E44 |
0.382938 |
30 |
800.0 |
800.416667 |
800.57 |
802.166667 |
NaN |
NaN |
NaN |
3634.0 |
3748.0 |
34 |
-0.096798 |
-0.317500 |
-0.090278 |
0.380667 |
0.670588 |
22.8 |
25.0 |
95.8 |
22.8 |
0.0 |
4.090872 |
NaN |
4.090872 |