| 2025-12-04 08:45:00+08:00 |
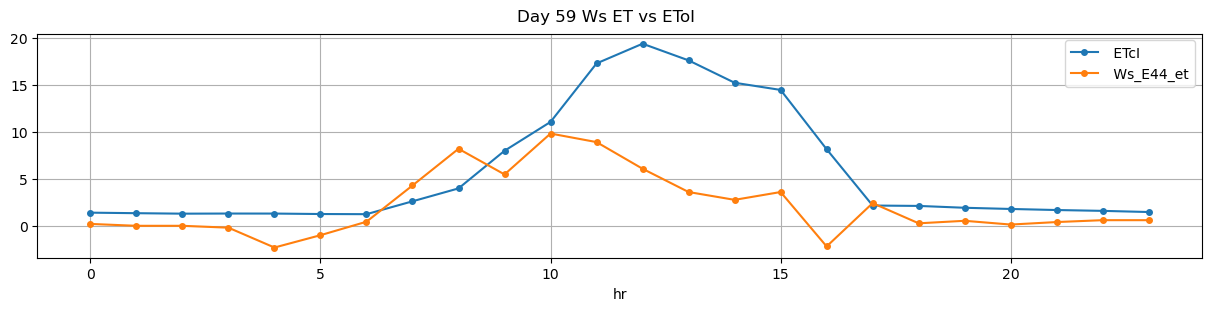
59 |
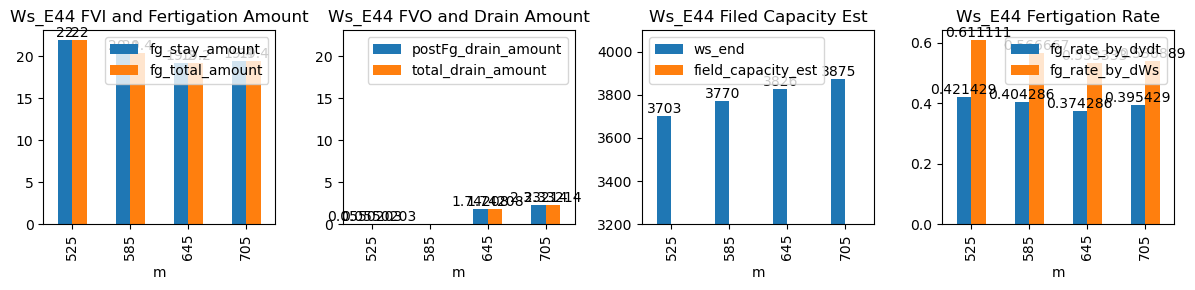
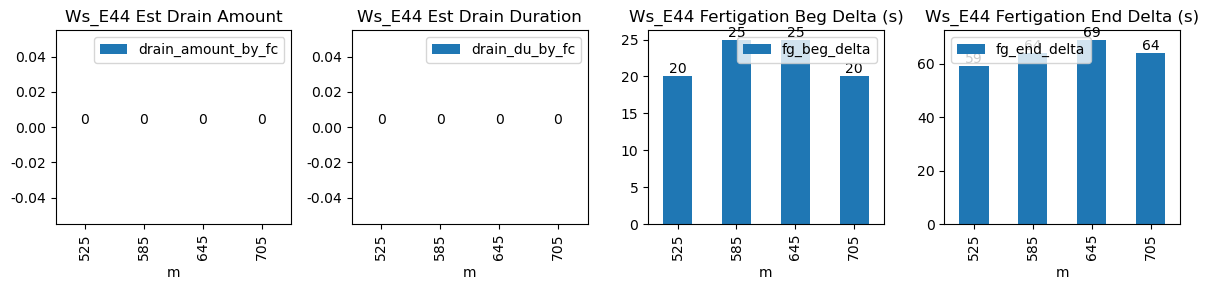
525 |
Ws_E44 |
0.309551 |
30 |
525.0 |
525.333333 |
525.6 |
526.583333 |
NaN |
NaN |
NaN |
3593.0 |
3703.0 |
36 |
-0.056909 |
NaN |
-0.094323 |
0.421429 |
0.611111 |
22.0 |
20.0 |
59.0 |
22.0 |
0.0 |
0.055020 |
NaN |
0.055020 |
| 2025-12-04 09:45:00+08:00 |
59 |
585 |
Ws_E44 |
0.309551 |
30 |
585.0 |
585.416667 |
585.6 |
586.666667 |
NaN |
NaN |
NaN |
3668.0 |
3770.0 |
36 |
-0.001554 |
NaN |
-0.063399 |
0.404286 |
0.566667 |
20.4 |
25.0 |
64.0 |
20.4 |
0.0 |
-0.926472 |
NaN |
-0.926472 |
| 2025-12-04 10:45:00+08:00 |
59 |
645 |
Ws_E44 |
0.309551 |
30 |
645.0 |
645.416667 |
645.6 |
646.750000 |
NaN |
NaN |
NaN |
3730.0 |
3826.0 |
36 |
-0.071893 |
NaN |
-0.001944 |
0.374286 |
0.533333 |
19.2 |
25.0 |
69.0 |
19.2 |
0.0 |
1.742076 |
NaN |
1.742076 |
| 2025-12-04 11:45:00+08:00 |
59 |
705 |
Ws_E44 |
0.309551 |
30 |
705.0 |
705.333333 |
705.6 |
706.666667 |
NaN |
NaN |
NaN |
3778.0 |
3875.0 |
36 |
-0.106230 |
NaN |
-0.044645 |
0.395429 |
0.538889 |
19.4 |
20.0 |
64.0 |
19.4 |
0.0 |
2.332143 |
NaN |
2.332143 |