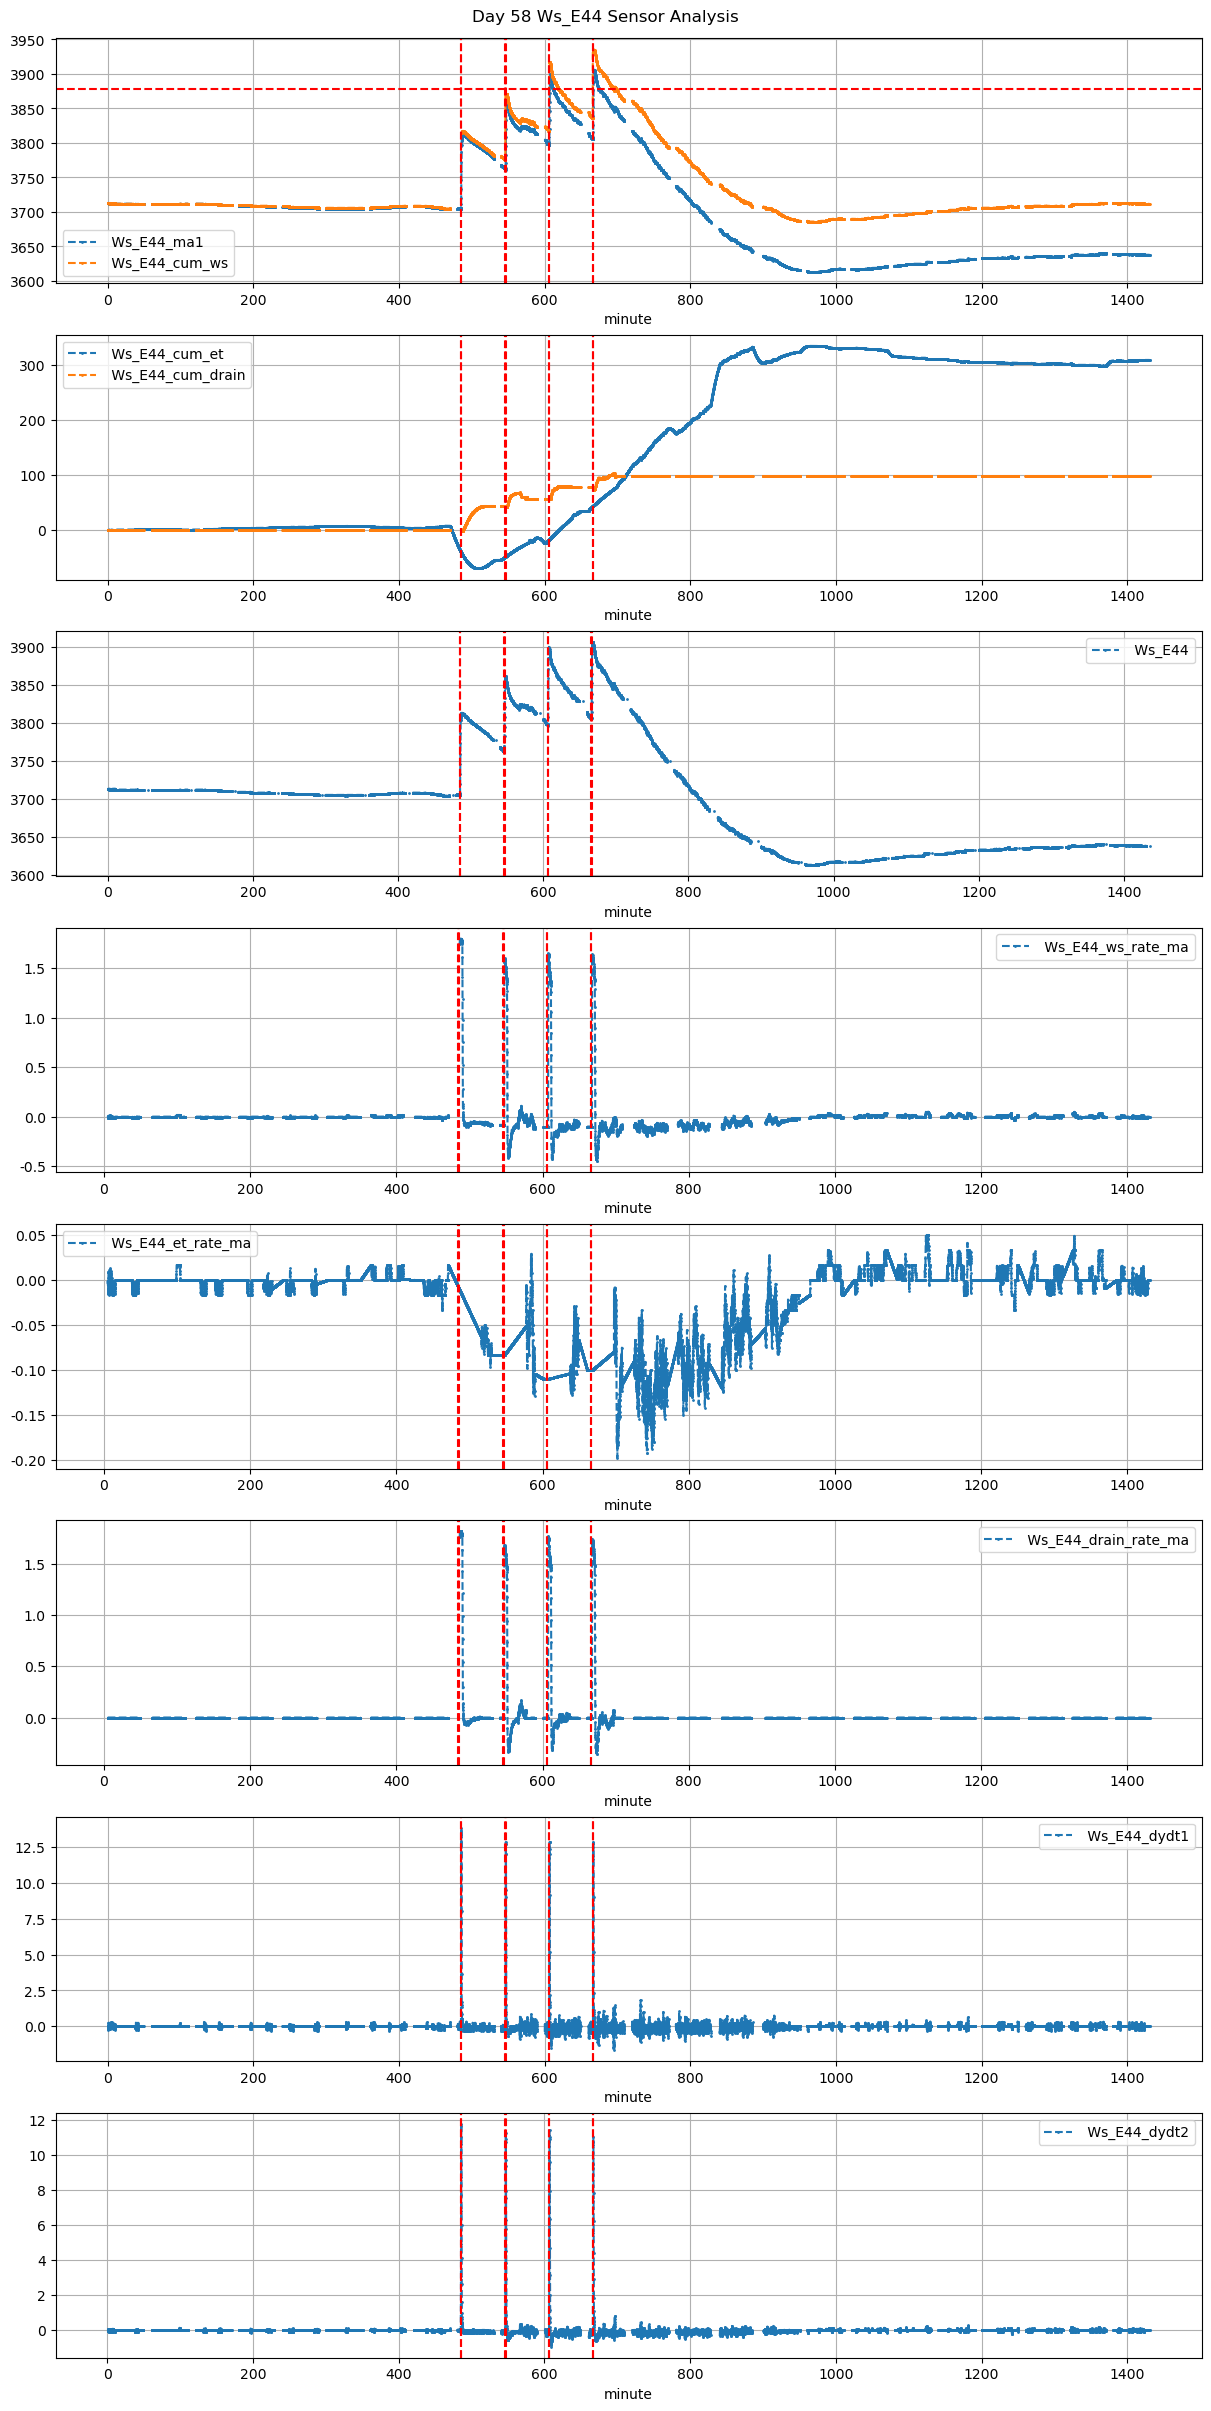
| 2025-12-03 08:05:00+08:00 |
58 |
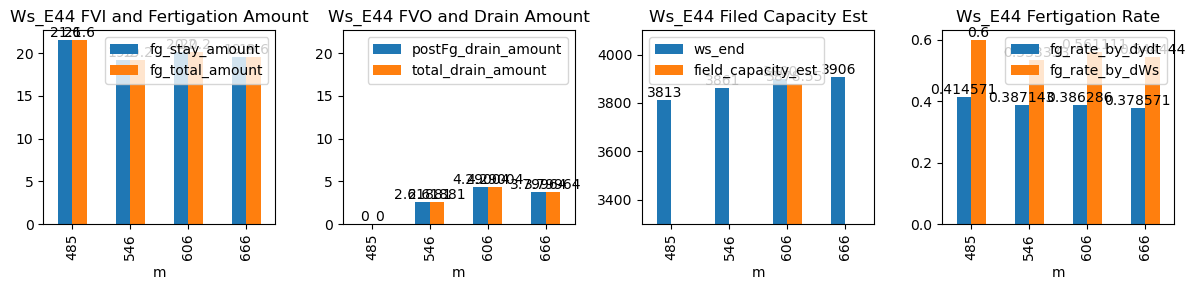
485 |
Ws_E44 |
0.420103 |
30 |
485.00 |
485.250000 |
485.60 |
486.583333 |
NaN |
NaN |
NaN |
3705.0 |
3813.0 |
36 |
NaN |
-0.073611 |
-0.063416 |
0.414571 |
0.600000 |
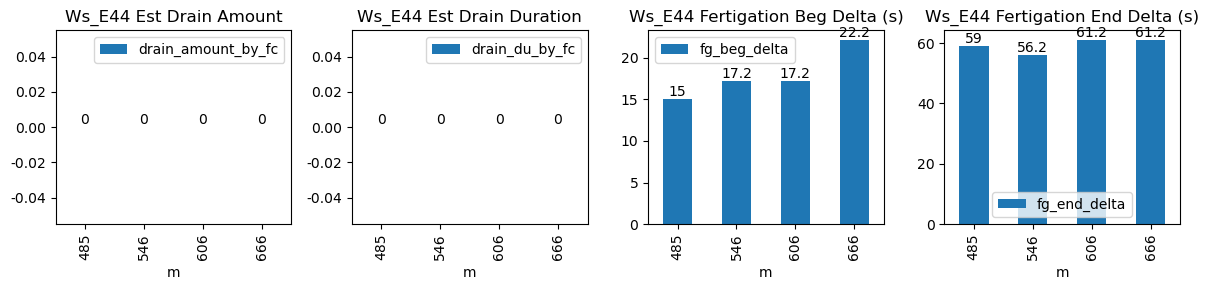
21.6 |
15.0 |
59.0 |
21.6 |
0.0 |
NaN |
NaN |
NaN |
| 2025-12-03 09:06:08+08:00 |
58 |
546 |
Ws_E44 |
0.420103 |
30 |
546.13 |
546.416667 |
546.73 |
547.666667 |
NaN |
NaN |
NaN |
3765.0 |
3861.0 |
36 |
-0.083333 |
-0.297639 |
-0.050457 |
0.387143 |
0.533333 |
19.2 |
17.2 |
56.2 |
19.2 |
0.0 |
2.618809 |
NaN |
2.618809 |
| 2025-12-03 10:06:08+08:00 |
58 |
606 |
Ws_E44 |
0.420103 |
30 |
606.13 |
606.416667 |
606.73 |
607.750000 |
NaN |
NaN |
NaN |
3799.0 |
3900.0 |
36 |
-0.109615 |
-0.257778 |
-0.103472 |
0.386286 |
0.561111 |
20.2 |
17.2 |
61.2 |
20.2 |
0.0 |
4.290043 |
3878.549785 |
4.290043 |
| 2025-12-03 11:06:08+08:00 |
58 |
666 |
Ws_E44 |
0.420103 |
30 |
666.13 |
666.500000 |
666.73 |
667.750000 |
NaN |
NaN |
NaN |
3808.0 |
3906.0 |
36 |
-0.100000 |
-0.310417 |
-0.079323 |
0.378571 |
0.544444 |
19.6 |
22.2 |
61.2 |
19.6 |
0.0 |
3.799641 |
NaN |
3.799641 |