| 2025-12-02 09:05:00+08:00 |
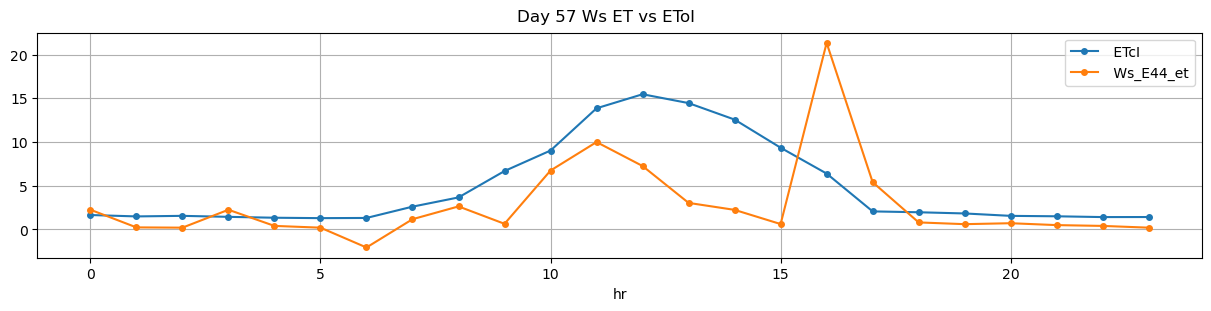
57 |
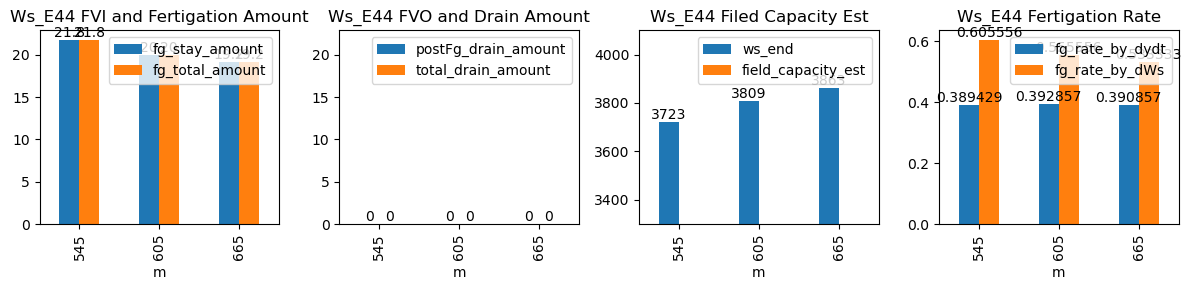
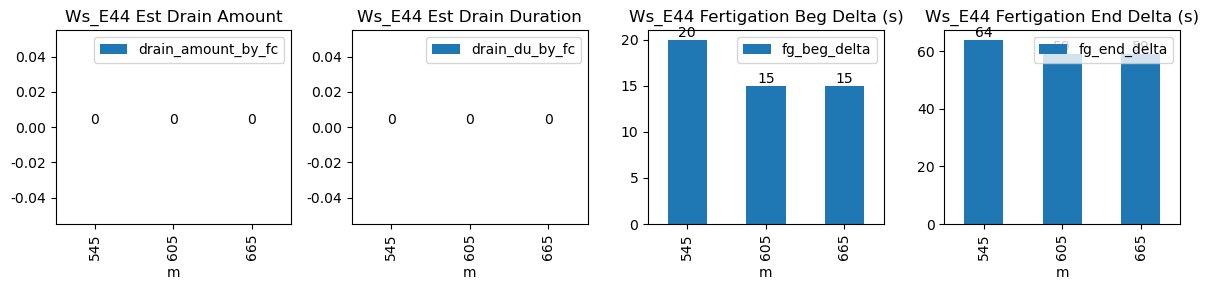
545 |
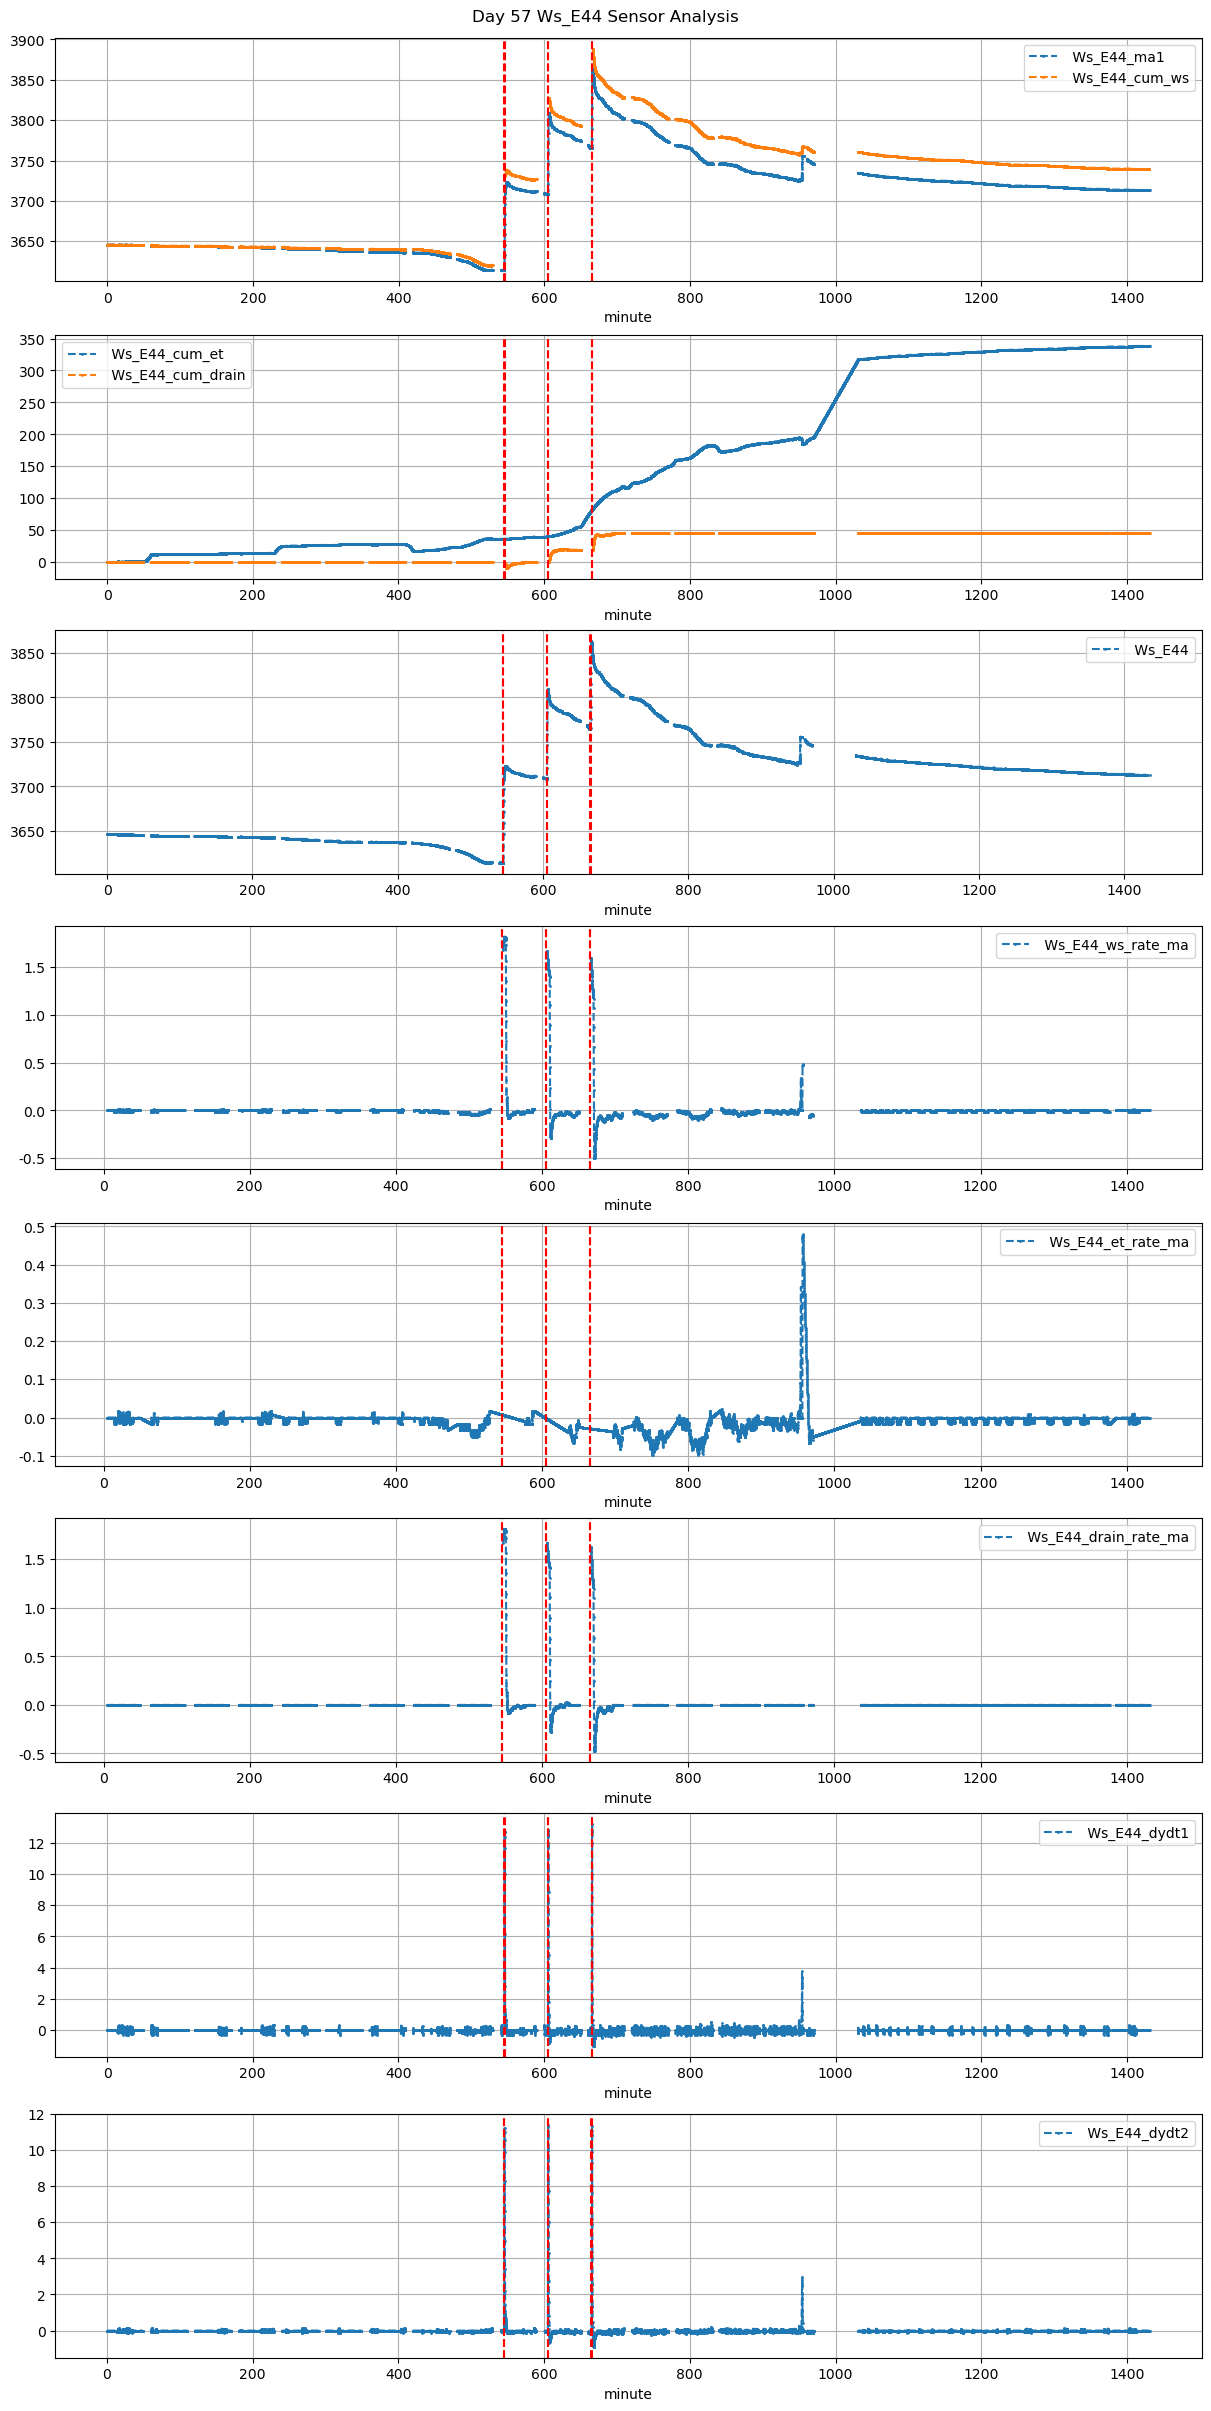
Ws_E44 |
0.281271 |
30 |
545.0 |
545.333333 |
545.6 |
546.666667 |
NaN |
NaN |
NaN |
3614.0 |
3723.0 |
36 |
NaN |
-0.051250 |
-0.009815 |
0.389429 |
0.605556 |
21.8 |
20.0 |
64.0 |
21.8 |
0.0 |
NaN |
NaN |
NaN |
| 2025-12-02 10:05:00+08:00 |
57 |
605 |
Ws_E44 |
0.281271 |
30 |
605.0 |
605.250000 |
605.6 |
606.583333 |
NaN |
NaN |
NaN |
3709.0 |
3809.0 |
36 |
NaN |
-0.135972 |
-0.038939 |
0.392857 |
0.555556 |
20.0 |
15.0 |
59.0 |
20.0 |
0.0 |
NaN |
NaN |
NaN |
| 2025-12-02 11:05:00+08:00 |
57 |
665 |
Ws_E44 |
0.281271 |
30 |
665.0 |
665.250000 |
665.6 |
666.583333 |
NaN |
NaN |
NaN |
3767.0 |
3863.0 |
36 |
NaN |
-0.243750 |
-0.036273 |
0.390857 |
0.533333 |
19.2 |
15.0 |
59.0 |
19.2 |
0.0 |
NaN |
NaN |
NaN |