| 2025-12-05 08:05:00+08:00 |
60 |
485 |
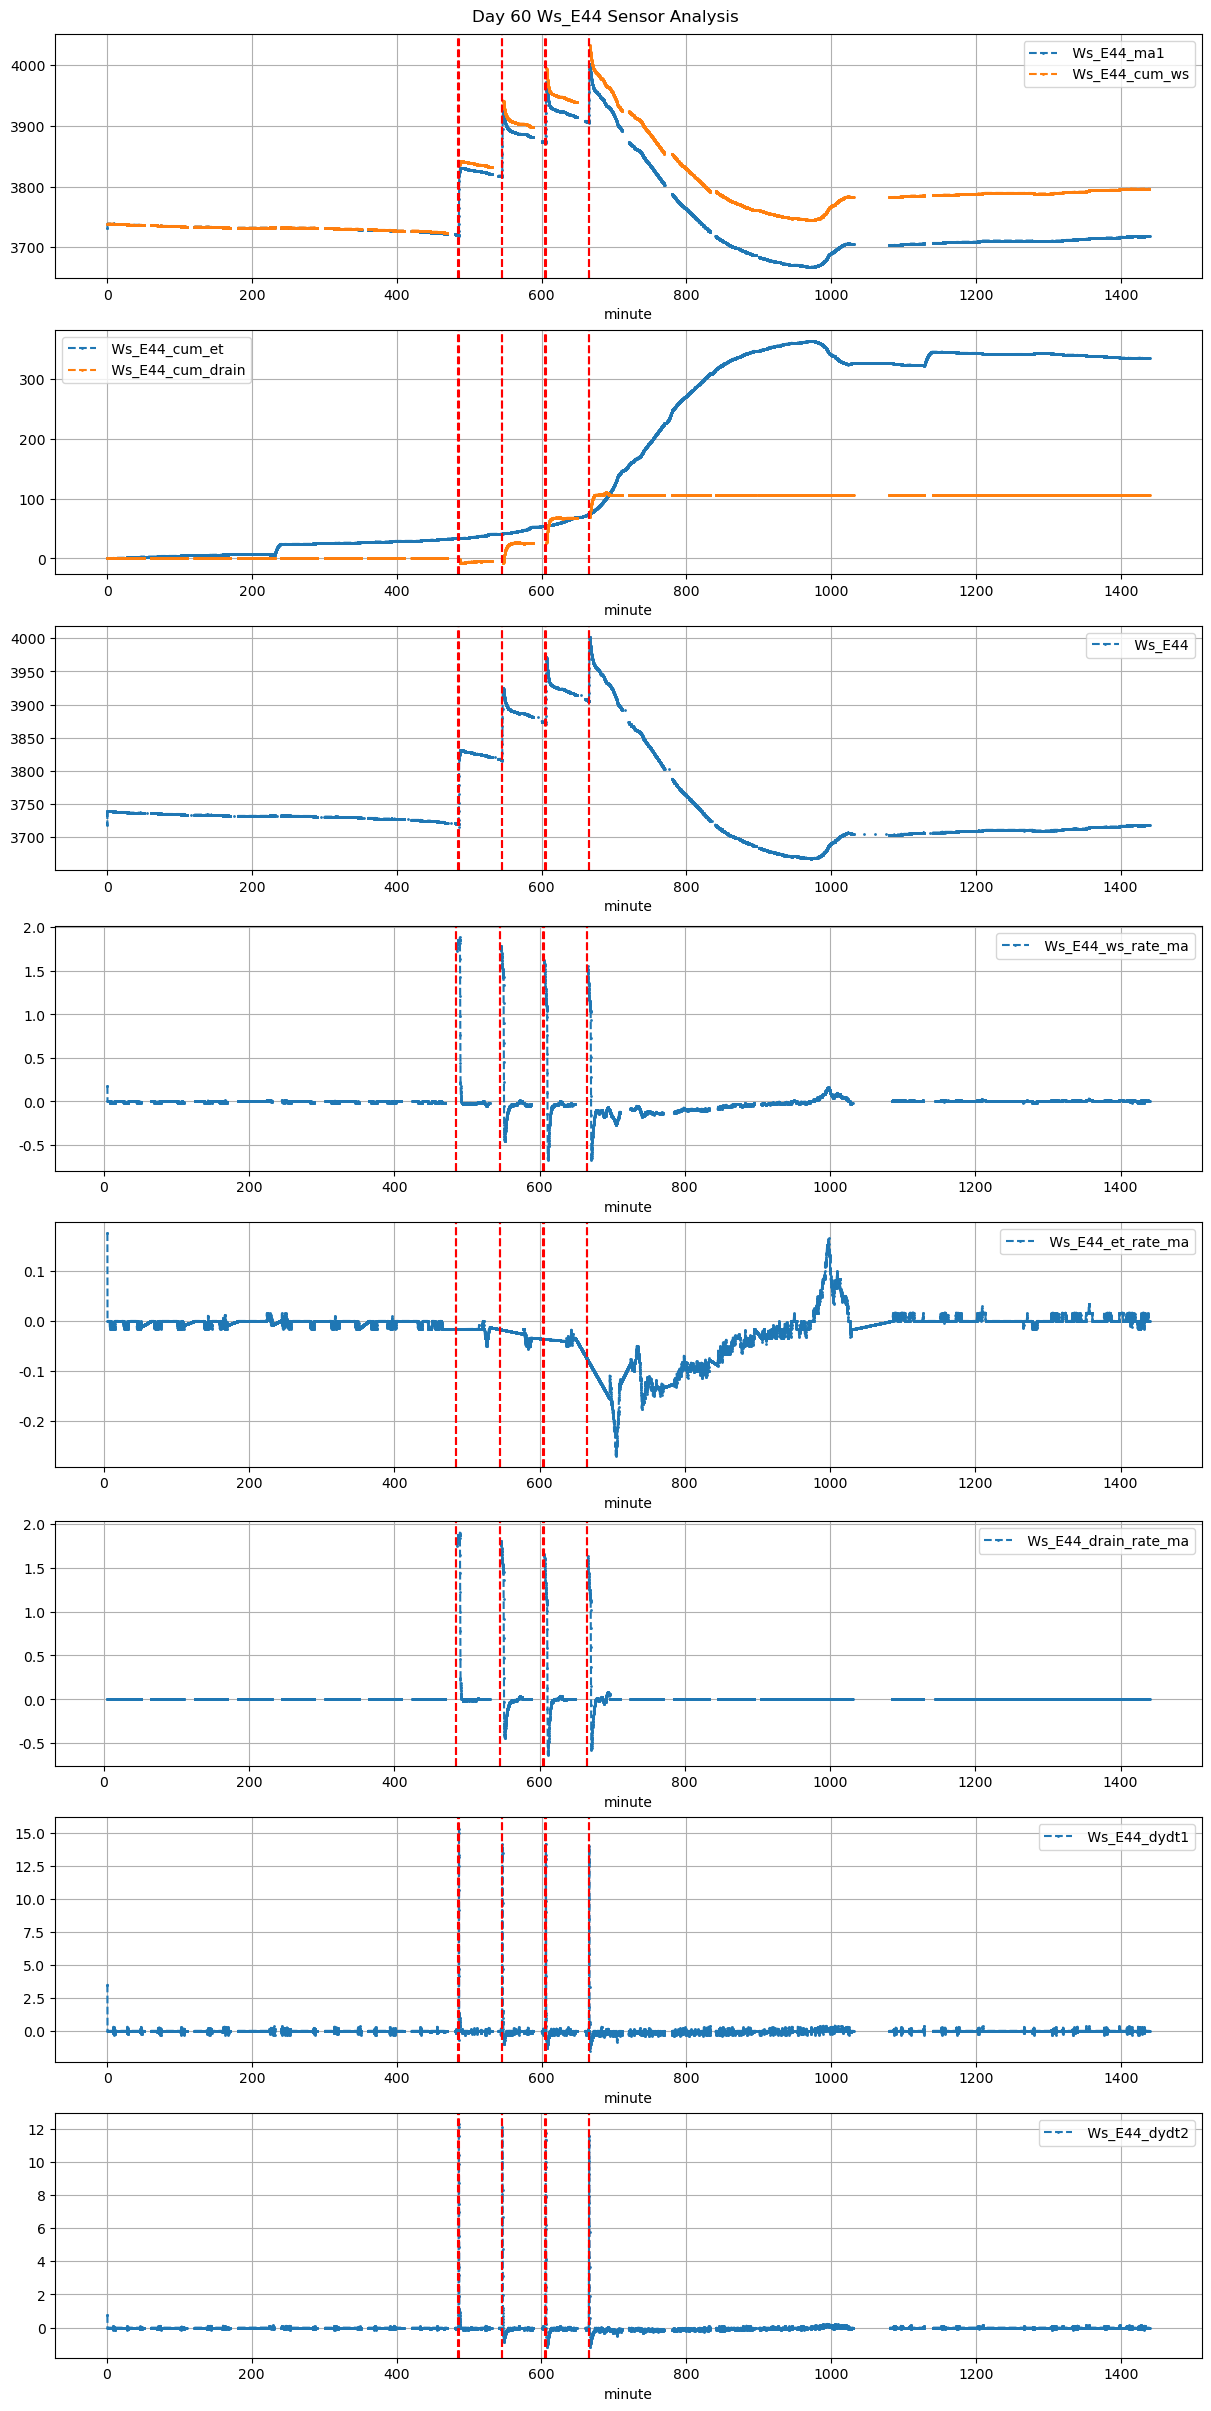
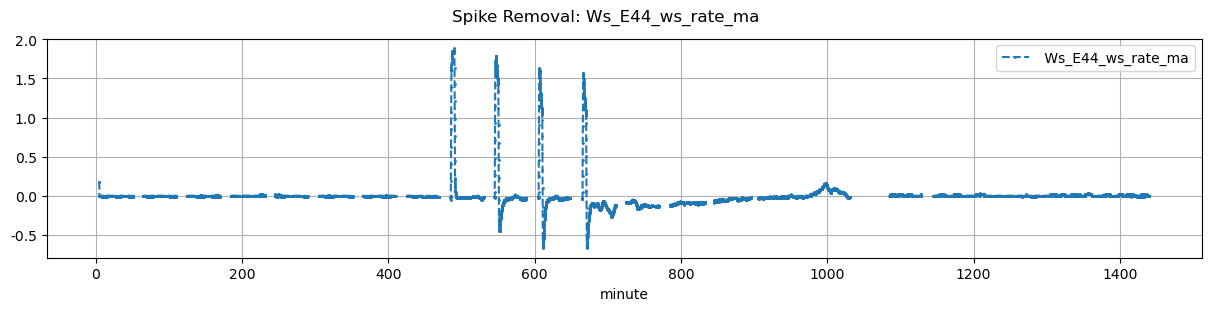
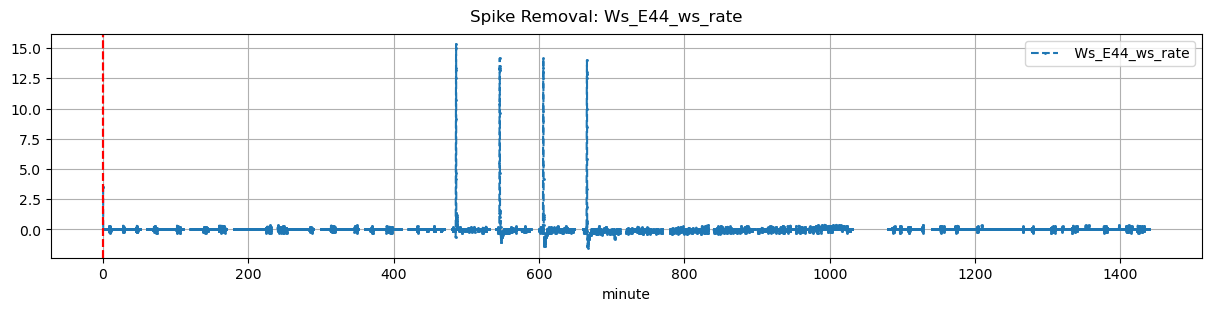
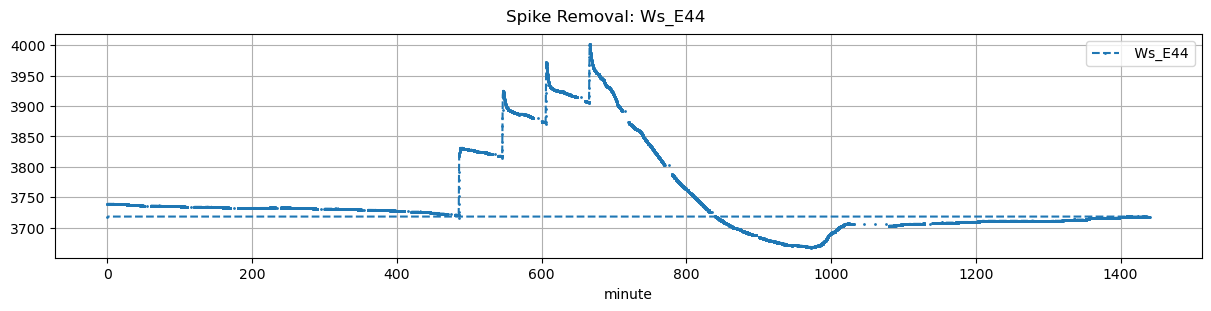
Ws_E44 |
0.439309 |
30 |
485.0 |
485.333333 |
485.58 |
486.583333 |
NaN |
NaN |
NaN |
3720.0 |
3831.0 |
35 |
NaN |
-0.010556 |
-0.015787 |
0.417143 |
0.634286 |
22.2 |
20.0 |
60.2 |
22.2 |
0.0 |
NaN |
NaN |
NaN |
| 2025-12-05 09:05:00+08:00 |
60 |
545 |
Ws_E44 |
0.439309 |
30 |
545.0 |
545.416667 |
545.58 |
546.666667 |
NaN |
NaN |
NaN |
3818.0 |
3925.0 |
35 |
NaN |
-0.267222 |
-0.025556 |
0.410000 |
0.611429 |
21.4 |
25.0 |
65.2 |
21.4 |
0.0 |
NaN |
NaN |
NaN |
| 2025-12-05 10:05:00+08:00 |
60 |
605 |
Ws_E44 |
0.439309 |
30 |
605.0 |
605.416667 |
605.58 |
606.583333 |
NaN |
NaN |
NaN |
3874.0 |
3972.0 |
35 |
NaN |
-0.300417 |
-0.040139 |
0.410286 |
0.560000 |
19.6 |
25.0 |
60.2 |
19.6 |
0.0 |
NaN |
NaN |
NaN |
| 2025-12-05 11:05:00+08:00 |
60 |
665 |
Ws_E44 |
0.439309 |
30 |
665.0 |
665.416667 |
665.58 |
666.583333 |
NaN |
NaN |
NaN |
3907.0 |
4002.0 |
35 |
NaN |
-0.336250 |
-0.155664 |
0.410286 |
0.542857 |
19.0 |
25.0 |
60.2 |
19.0 |
0.0 |
NaN |
NaN |
NaN |