| 2025-12-06 08:06:16+08:00 |
61 |
486 |
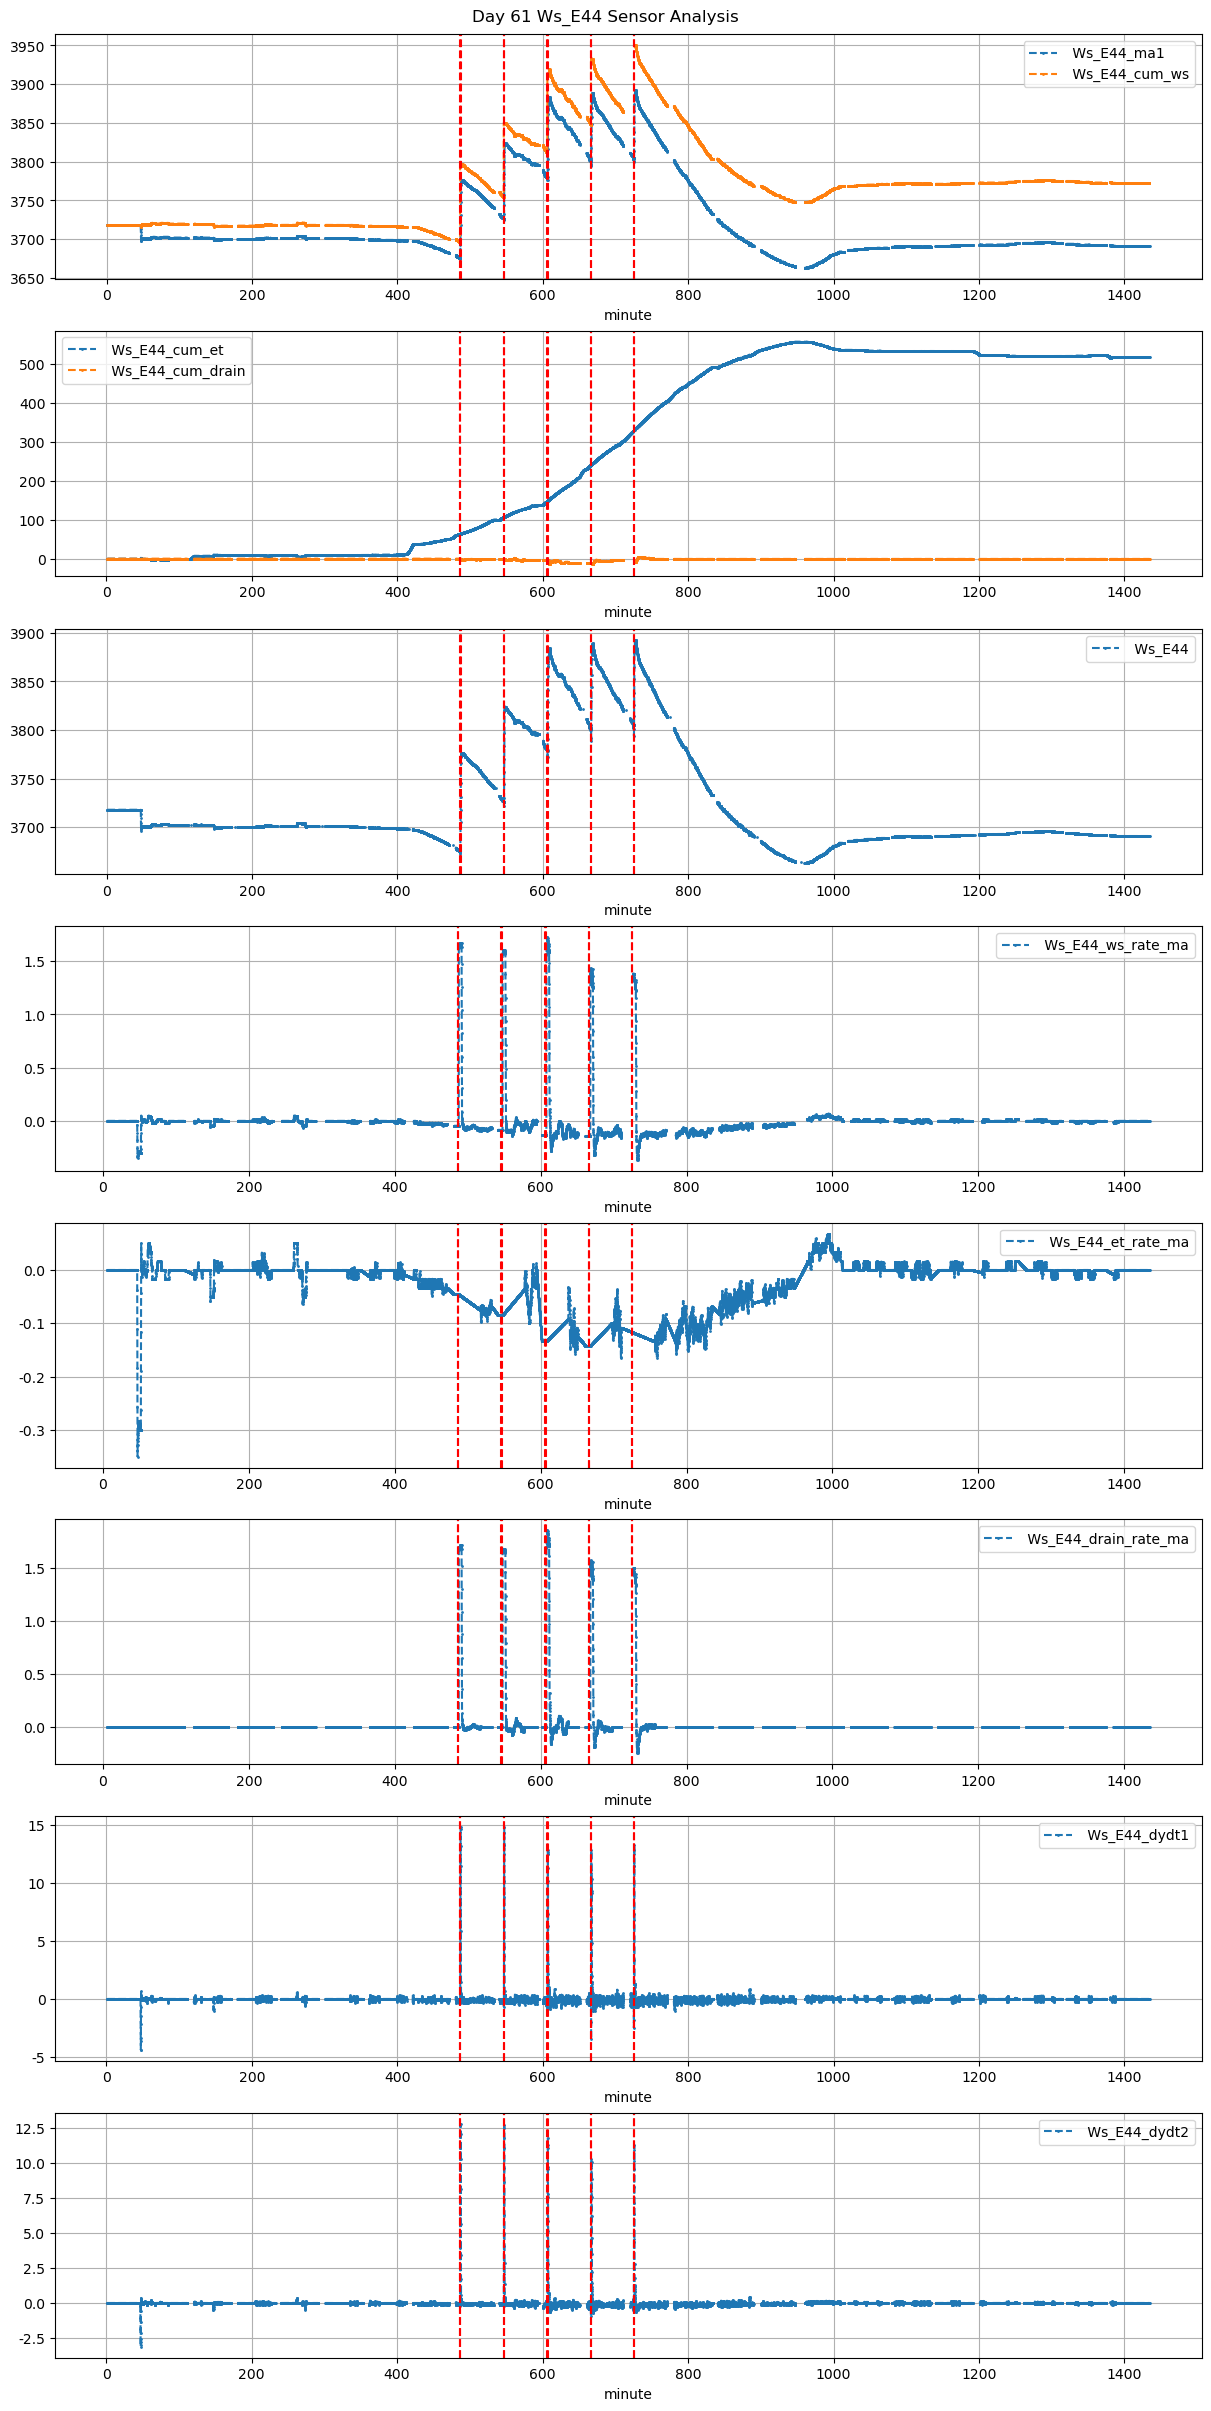
Ws_E44 |
0.483254 |
30 |
486.27 |
486.583333 |
486.84 |
487.750000 |
NaN |
NaN |
NaN |
3677.0 |
3776.0 |
34 |
-0.045833 |
-0.064028 |
-0.075382 |
0.440667 |
0.582353 |
19.8 |
18.8 |
54.6 |
19.8 |
0.0 |
-0.351021 |
NaN |
-0.351021 |
| 2025-12-06 09:06:16+08:00 |
61 |
546 |
Ws_E44 |
0.483254 |
30 |
546.27 |
546.666667 |
546.84 |
547.833333 |
NaN |
NaN |
NaN |
3728.0 |
3824.0 |
34 |
-0.084444 |
-0.095694 |
-0.035509 |
0.448667 |
0.564706 |
19.2 |
23.8 |
59.6 |
19.2 |
0.0 |
-0.340268 |
NaN |
-0.340268 |
| 2025-12-06 10:06:16+08:00 |
61 |
606 |
Ws_E44 |
0.483254 |
30 |
606.27 |
606.583333 |
606.84 |
607.916667 |
NaN |
NaN |
NaN |
3781.0 |
3884.0 |
34 |
-0.133333 |
-0.190972 |
-0.091448 |
0.387333 |
0.605882 |
20.6 |
18.8 |
64.6 |
20.6 |
0.0 |
-1.407607 |
NaN |
-1.407607 |
| 2025-12-06 11:06:16+08:00 |
61 |
666 |
Ws_E44 |
0.483254 |
30 |
666.27 |
666.666667 |
666.84 |
668.083333 |
NaN |
NaN |
NaN |
3803.0 |
3889.0 |
34 |
-0.142188 |
-0.219028 |
-0.098651 |
0.340000 |
0.505882 |
17.2 |
23.8 |
74.6 |
17.2 |
0.0 |
1.455175 |
NaN |
1.455175 |
| 2025-12-06 12:05:00+08:00 |
61 |
725 |
Ws_E44 |
0.483254 |
30 |
725.00 |
725.500000 |
725.57 |
726.750000 |
NaN |
NaN |
NaN |
3809.0 |
3892.0 |
34 |
NaN |
-0.256250 |
-0.134306 |
0.381667 |
0.488235 |
16.6 |
30.0 |
70.8 |
17.0 |
0.4 |
NaN |
NaN |
NaN |