| 2025-12-07 08:05:00+08:00 |
62 |
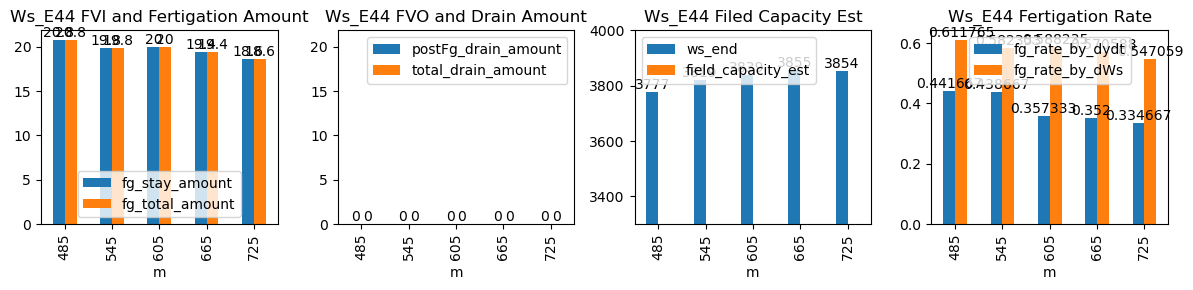
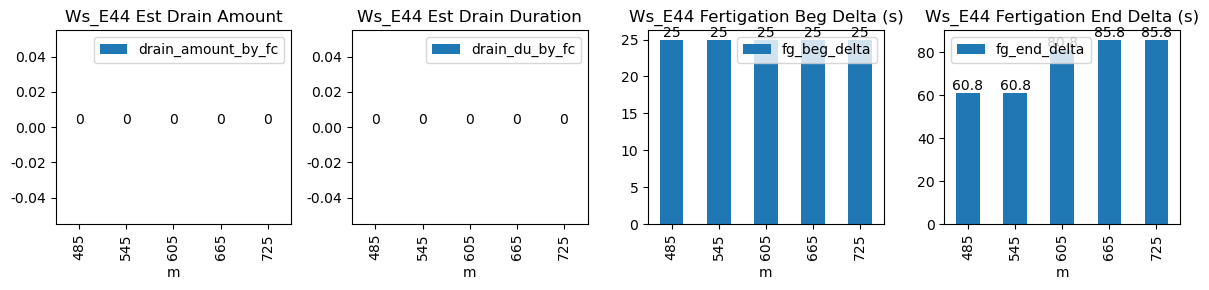
485 |
Ws_E44 |
0.449677 |
30 |
485.0 |
485.416667 |
485.57 |
486.583333 |
NaN |
NaN |
NaN |
3673.0 |
3777.0 |
34 |
NaN |
-0.065556 |
-0.088488 |
0.441667 |
0.611765 |
20.8 |
25.0 |
60.8 |
20.8 |
0.0 |
NaN |
NaN |
NaN |
| 2025-12-07 09:05:00+08:00 |
62 |
545 |
Ws_E44 |
0.449677 |
30 |
545.0 |
545.416667 |
545.57 |
546.583333 |
NaN |
NaN |
NaN |
3720.0 |
3819.0 |
34 |
NaN |
-0.106667 |
-0.167523 |
0.438667 |
0.582353 |
19.8 |
25.0 |
60.8 |
19.8 |
0.0 |
NaN |
NaN |
NaN |
| 2025-12-07 10:05:00+08:00 |
62 |
605 |
Ws_E44 |
0.449677 |
30 |
605.0 |
605.416667 |
605.57 |
606.916667 |
NaN |
NaN |
NaN |
3739.0 |
3839.0 |
34 |
NaN |
-0.173611 |
-0.086736 |
0.357333 |
0.588235 |
20.0 |
25.0 |
80.8 |
20.0 |
0.0 |
NaN |
NaN |
NaN |
| 2025-12-07 11:05:00+08:00 |
62 |
665 |
Ws_E44 |
0.449677 |
30 |
665.0 |
665.416667 |
665.57 |
667.000000 |
NaN |
NaN |
NaN |
3758.0 |
3855.0 |
34 |
NaN |
-0.238333 |
-0.124682 |
0.352000 |
0.570588 |
19.4 |
25.0 |
85.8 |
19.4 |
0.0 |
NaN |
NaN |
NaN |
| 2025-12-07 12:05:00+08:00 |
62 |
725 |
Ws_E44 |
0.449677 |
30 |
725.0 |
725.416667 |
725.57 |
727.000000 |
NaN |
NaN |
NaN |
3761.0 |
3854.0 |
34 |
NaN |
-0.268194 |
-0.114673 |
0.334667 |
0.547059 |
18.6 |
25.0 |
85.8 |
18.6 |
0.0 |
NaN |
NaN |
NaN |