| 2025-12-08 08:05:00+08:00 |
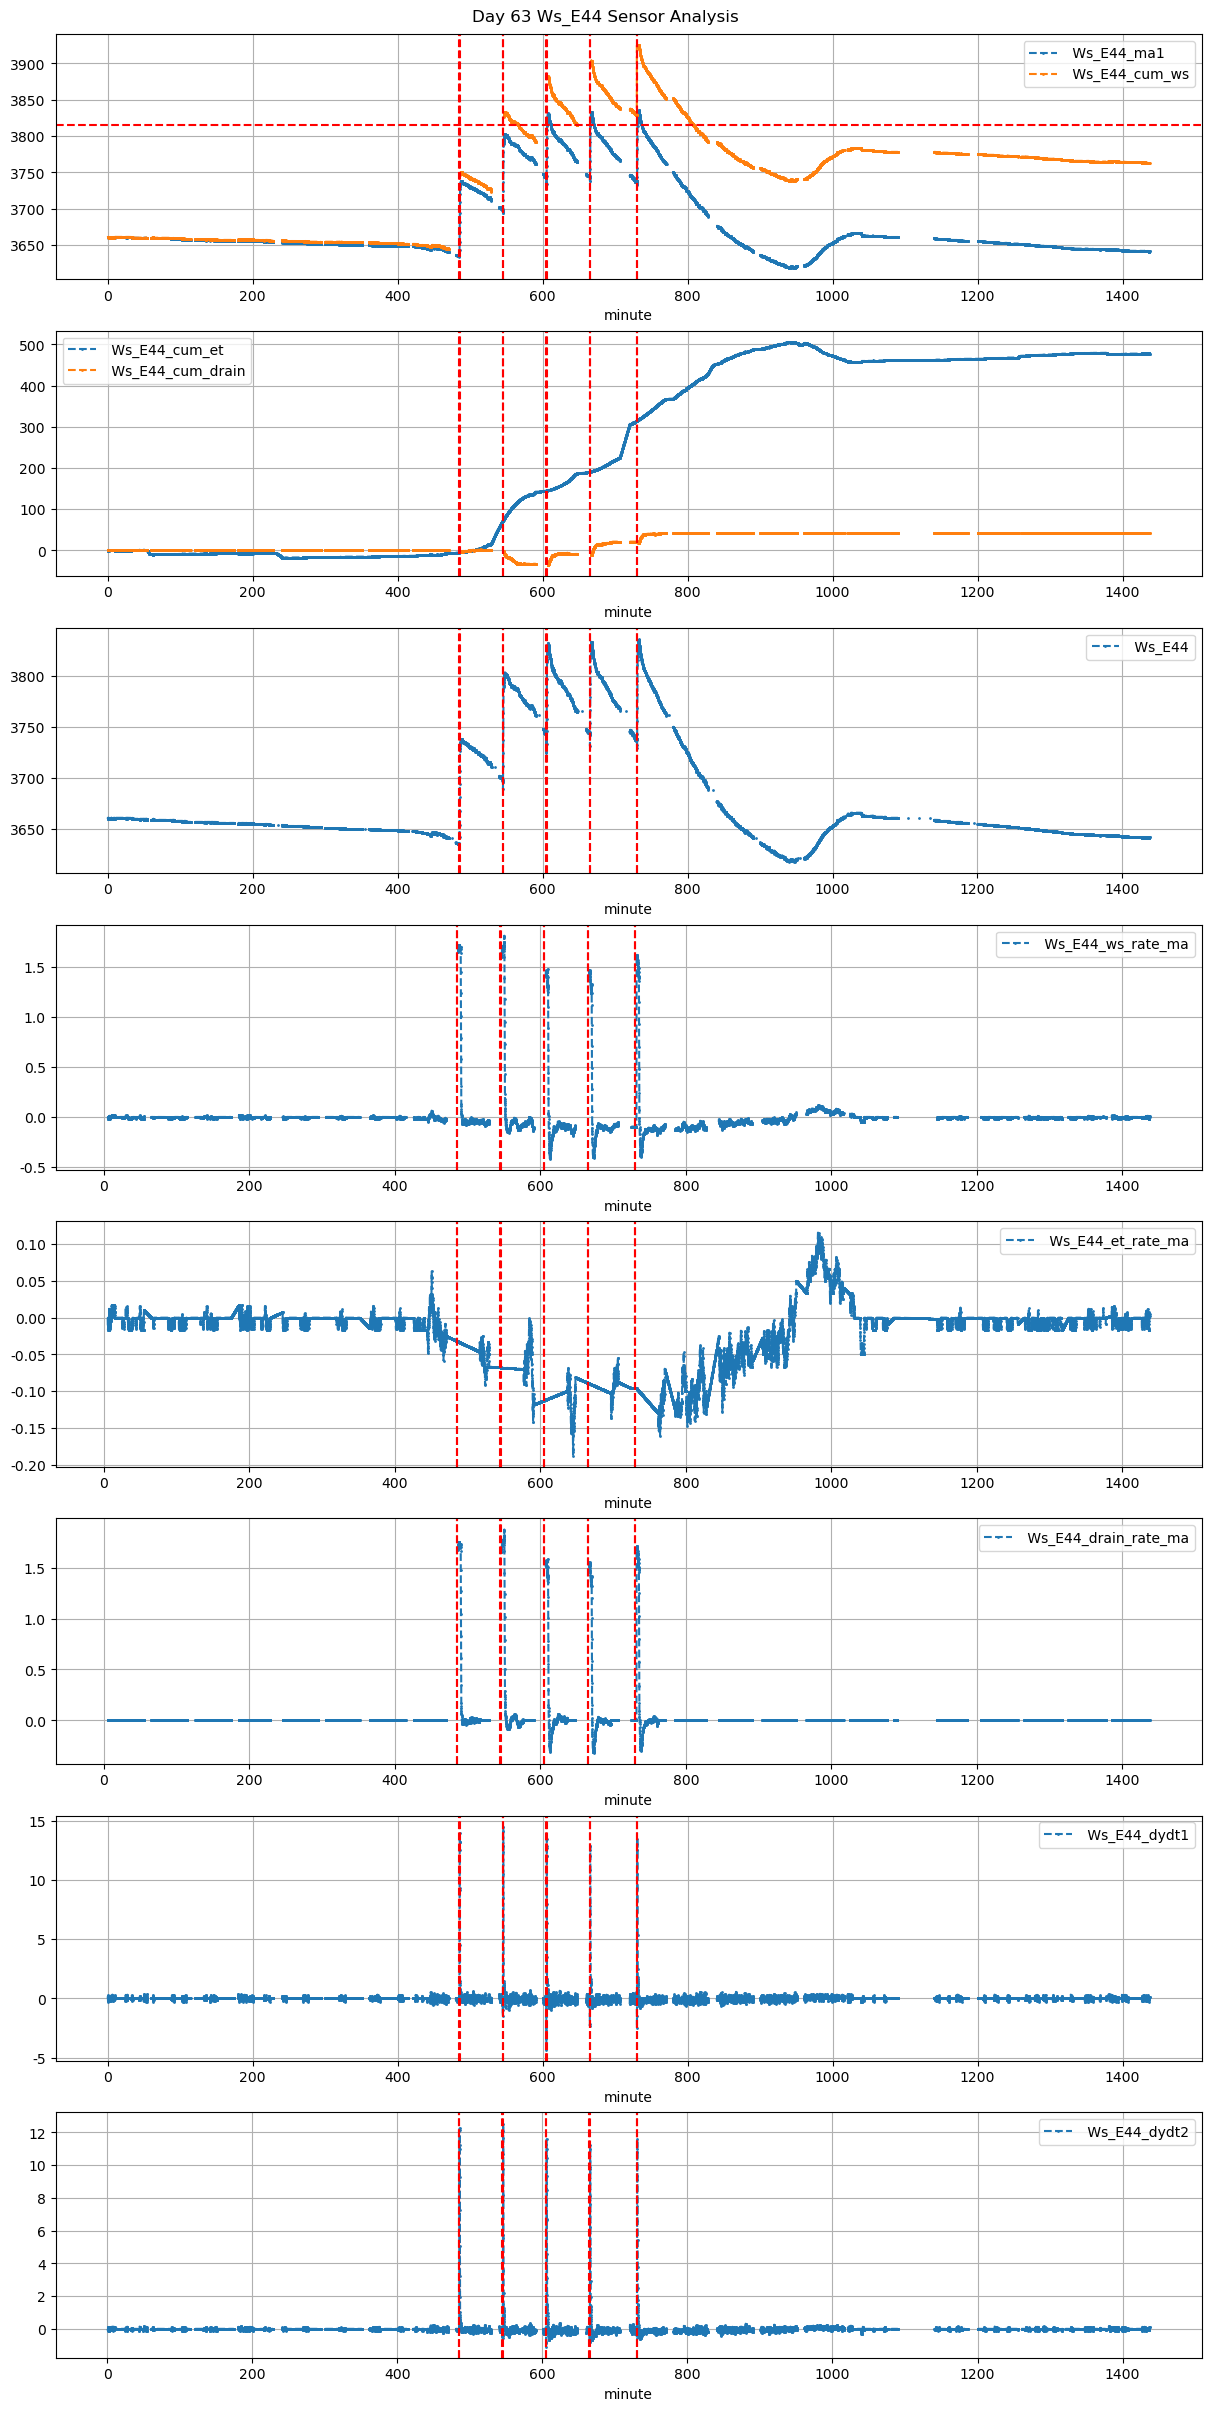
63 |
485 |
Ws_E44 |
0.431707 |
30 |
485.0 |
485.416667 |
485.57 |
486.583333 |
NaN |
NaN |
NaN |
3636.0 |
3738.0 |
34 |
NaN |
-0.045417 |
-0.046250 |
0.441667 |
0.600000 |
20.4 |
25.0 |
60.8 |
20.4 |
0.0 |
NaN |
NaN |
NaN |
| 2025-12-08 09:05:00+08:00 |
63 |
545 |
Ws_E44 |
0.431707 |
30 |
545.0 |
545.416667 |
545.57 |
546.666667 |
NaN |
NaN |
NaN |
3701.0 |
3803.0 |
34 |
NaN |
-0.108472 |
-0.069861 |
0.426667 |
0.600000 |
20.4 |
25.0 |
65.8 |
20.4 |
0.0 |
NaN |
NaN |
NaN |
| 2025-12-08 10:05:00+08:00 |
63 |
605 |
Ws_E44 |
0.431707 |
30 |
605.0 |
605.500000 |
605.57 |
607.083333 |
NaN |
NaN |
NaN |
3744.0 |
3832.0 |
34 |
NaN |
-0.281806 |
-0.099407 |
0.346667 |
0.517647 |
17.6 |
30.0 |
90.8 |
17.6 |
0.0 |
NaN |
NaN |
NaN |
| 2025-12-08 11:05:00+08:00 |
63 |
665 |
Ws_E44 |
0.431707 |
30 |
665.0 |
665.500000 |
665.57 |
666.916667 |
NaN |
NaN |
NaN |
3746.0 |
3833.0 |
34 |
NaN |
-0.286806 |
-0.102560 |
0.365000 |
0.511765 |
17.4 |
30.0 |
80.8 |
17.4 |
0.0 |
NaN |
NaN |
NaN |
| 2025-12-08 12:10:00+08:00 |
63 |
730 |
Ws_E44 |
0.431707 |
30 |
730.0 |
730.416667 |
730.57 |
732.083333 |
NaN |
NaN |
NaN |
3739.0 |
3836.0 |
34 |
-0.096045 |
-0.289861 |
-0.130208 |
0.363333 |
0.570588 |
19.4 |
25.0 |
90.8 |
19.4 |
0.0 |
4.061352 |
3815.69324 |
4.061352 |